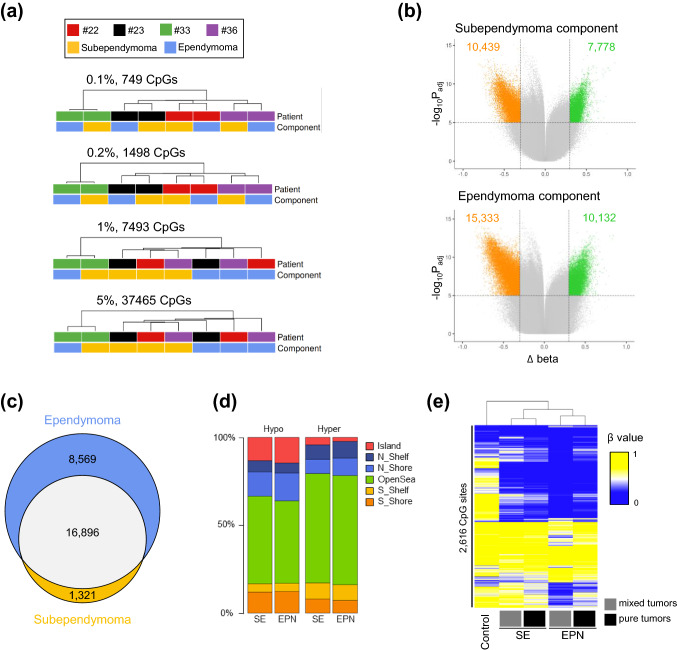
Fig. 2.
Characteristics of the methylome of ependymoma and subependymoma components. a Unsupervised hierarchical clustering of the top 0.1%, 0.2%, 1% and 5% most variable CpG sites. Annotations of sample type and patient identification numbers are provided. b The average methylation change from subependymoma components to normal brain controls (top) and ependymoma to normal brain controls (bottom). Colored dots represent CpG sites that show significant hypomethylation (orange dots, total count provided) or hypermethylation (green dots, total numbers provided) at each tumor component (p valueadjusted < 0.05 and |∆β|> 0.3). c Venn diagram showing overlap and unique CpG sites for each component. d Fractions of hypo- and hypermethylated unique CpG sites of subependymoma (SE) and ependymoma (EPN) components compared to normal brain stem tissue within different epigenomic substructures. e Unsupervised hierarchical clustering of 2616 differentially methylated CpG sites between the ependymoma and subependymoma component (p valueadjusted < 0.05). Heatmap shows average β values of brain stem control samples (n = 12), subependymoma and ependymoma component of mixed tumors (each n = 4), and pure subependymomas (n = 14) and ependymomas (n = 12)

