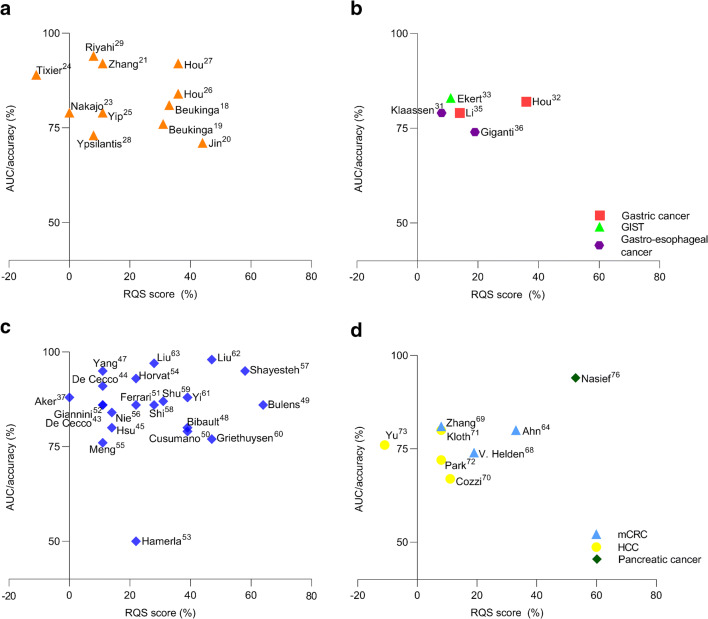
Fig. 2.
Overview of the radiomics quality scores (RQS) plotted against the best predictive performance of the radiomics models or features for different tumor types: (a) esophageal cancer, (b) gastric and gastroesophageal cancer, and gastrointestinal stromal tumors (GIST), (c) primary colorectal cancer, (d) metastatic colorectal cancer (mCRC), hepatic cellular carcinoma (HCC), pancreatic cancer. X-axis is the RQS score depicted as percentage of the maximum score (36 points = 100%). Y-axis is the best predictive performance of the radiomics features or models in terms of area under the curve (AUC) or accuracy

