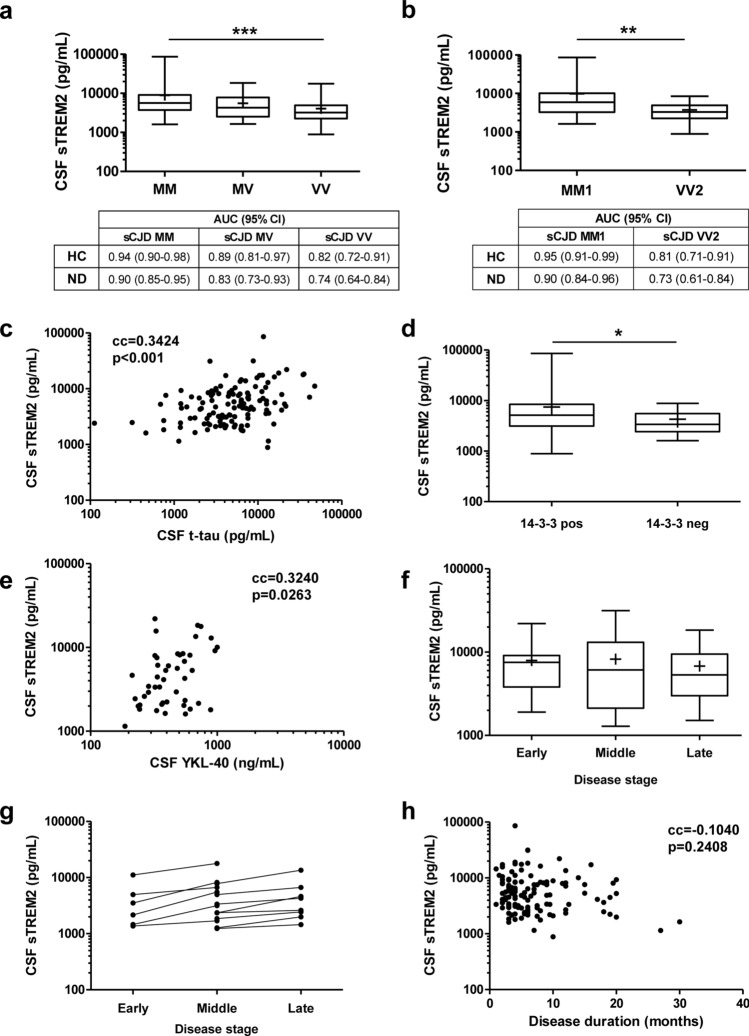
Fig. 5.
CSF sTREM2 in sCJD: association with codon129 genotype, sCJD subtype, CSF biomarkers, and clinical data. a CSF sTREM2 concentrations stratified by prion protein gene (PRNP) codon 129 polymorphism (M = methionine, V = valine). sCJD MM; n = 32, sCJD MV; n = 19 and sCJD VV; n = 17. Mean ( +), median (horizontal bar inside the box) and interquartile ranges are represented. Area under the curve (AUC) values with 95% confidence intervals (95% CI) indicated for each comparison. b CSF sTREM2 concentrations stratified by sCJD subtype MM1 (n = 20) and VV2 (n = 9). Mean ( +), median (horizontal bar inside the box), and interquartile ranges are represented. Area under the curve (AUC) values with 95% confidence intervals (95% CI) indicated for each comparison. c Correlation analysis between CSF TREM2 and CSF t-tau (n = 126). d Association analysis of CSF TREM2 concentrations with CSF 14-3-3 positivity. 14-3-3 positive cases; n = 118 and 14-3-3 negative cases; n = 21. Mean ( +), median (horizontal bar inside the box), and interquartile ranges are represented. e Correlation analysis between CSF sTREM2 and CSF YKL-40 (n = 47). f CSF sTREM2 concentrations stratified by disease stage at the time of lumbar puncture (LP). Samples were grouped into three categories according to whether they underwent LP in the first (< 0.33), second (0.33–0.66) or third (> 0.66) stage of the disease. Early disease stage, n = 15; middle disease stage, n = 21; late disease stage, n = 60. Mean ( +), median (horizontal bar inside the box), and interquartile ranges are represented. g Longitudinal analysis of CSF TREM2 concentrations in cases with available LP at different disease stages (n = 14). h Correlation analysis between sTREM2 concentrations and disease duration (months) (n = 126). cc: correlation coefficient; *p < 0.05, **p < 0.01, ***p < 0.001

