Figure 2.

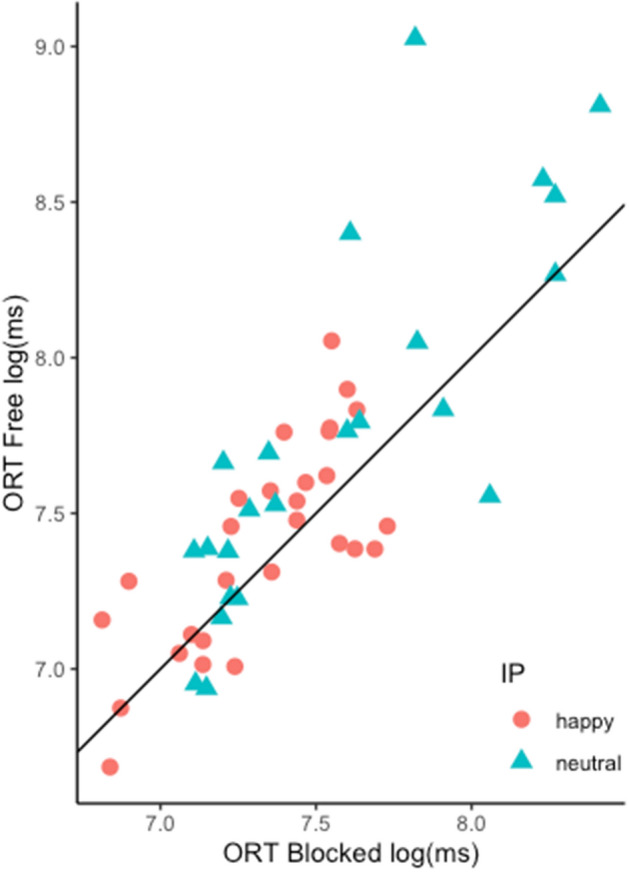
Each point represents a participant’s onset resolution time (ORT) for a specific IP. Mimicry condition is projected on the x and y axes, the black line represents the axes equidistance. The ORT is expressed in milliseconds.

Each point represents a participant’s onset resolution time (ORT) for a specific IP. Mimicry condition is projected on the x and y axes, the black line represents the axes equidistance. The ORT is expressed in milliseconds.