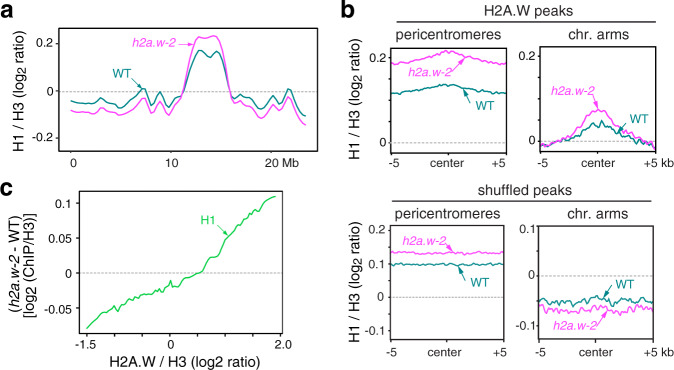
Fig. 5. H2A.W antagonizes histone H1 deposition in heterochromatin.
a Locally weighted scatterplot smoothing (LOESS) fit of H1 levels averaged in 1 kb bins across chromosome 3 in WT and h2a.w-2. Average of two replicates shown. b Metaplots of average H1 levels from two replicates over H2A.W peaks in pericentromeres and the chromosome arms (top panel). Plots over randomly shuffled peaks within the chromosome arms and pericentromeres are shown for comparison (bottom panel). c Smoothing spline fits (50 degrees of freedom) of change in H1 levels (h2a.w-2 minus WT; log2 ChIP/H3) in 1 kb windows plotted against WT H2A.W level. Source data underlying Fig. 5a are provided as a Source Data file.

