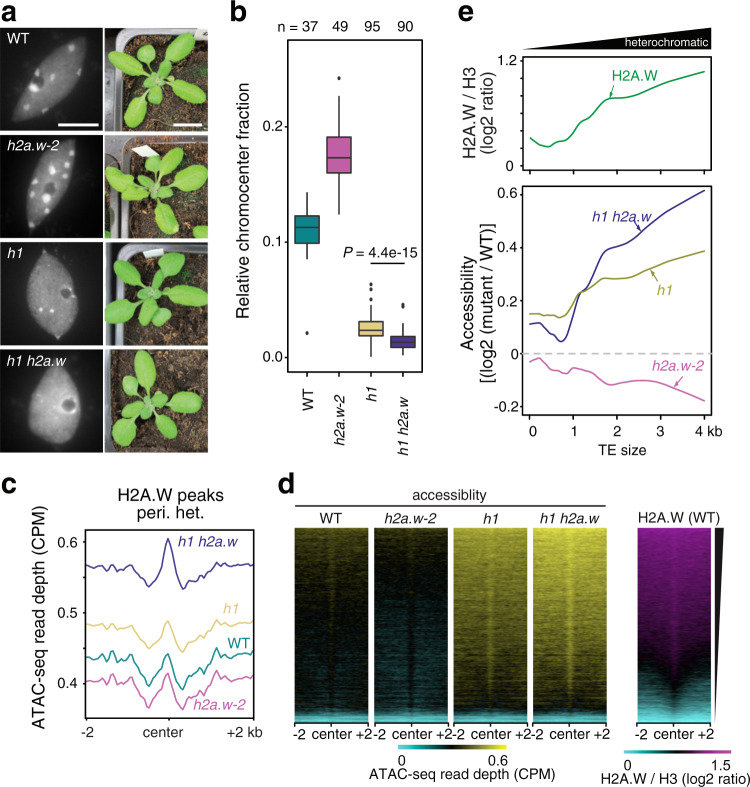
Fig. 6. H2A.W and H1 co-regulate heterochromatin accessibility.
a Representative images of DAPI-stained WT (Col-0), h2a.w-2, h1 and h1 h2a.w leaf interphase nuclei (left; scale bar is 5 µm) and of 3-week-old plants of the same genotypes (right; scale bar is 1 cm). Nuclear preparation and analysis were independently repeated three times with similar results. b Quantification of the relative chromocenter fraction in WT (Col-0), h2a.w-2, h1 and h1 h2a.w nuclei. Number of analyzed nuclei are indicated on the top. Whiskers indicate 1.5X IQR. Outliers are represented by circles. Relative chromocenter fraction in h1 and h1h2a.w show statistically significant difference (P = 4.4e-15, unpaired Mann–Whitney test). c ATAC-seq read depth over H2A.W peaks in pericentromeric heterochromatin. Average of two replicates shown. d Heat maps of average ATAC-seq read depth over H2A.W peaks in pericentromeres ranked based on level H2A.W signal in WT. e Locally weighted scatterplot smoothing (LOESS) fit of WT H2A.W levels (log2 ChIP/H3; top panel) and changes in chromatin accessibility (mutant / WT; ATAC-seq read depth) in 50 bp windows plotted against TE size.

