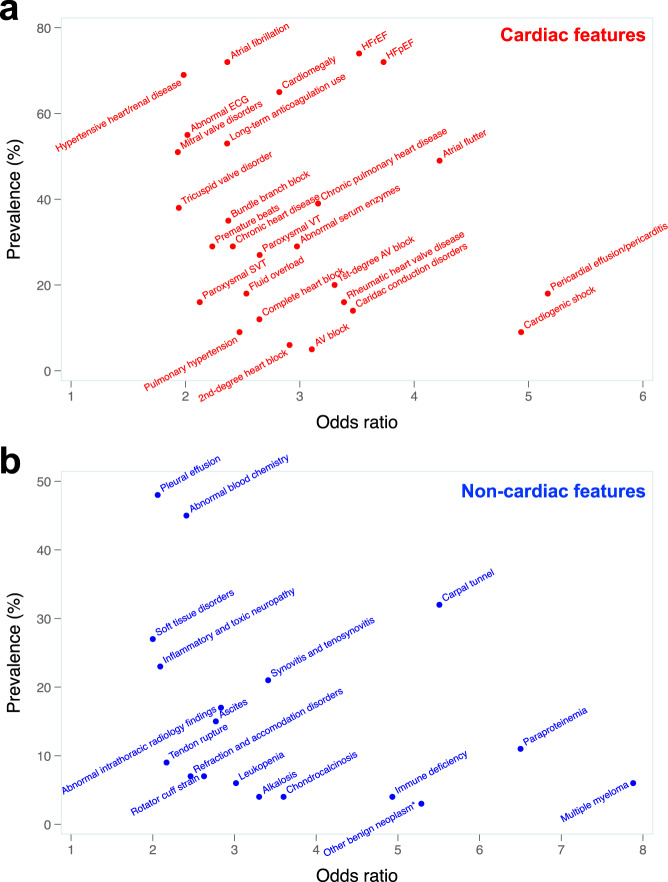
Fig. 2. Odds ratio vs. prevalence for top clinical phenotypes predictive of wild-type ATTR cardiomyopathy.
a Cardiac phenotypes associated with wild-type ATTR cardiomyopathy. b Non-cardiac phenotypes associated with wild-type ATTR cardiomyopathy. All features associated with the diagnosis of ATTR cardiomyopathy at a significance level of P < 10−4, which had an odds ratio (OR) < 10, were included in the graphs. The three features that had an OR > 10 that met the p-value threshold were: hypertrophic cardiomyopathy (OR 15.8, prevalence 11%); localized adiposity (OR 26.6, prevalence 2%); and organ transplantation (OR 23.4, prevalence 4%). Some diagnoses that were associated with ATTR cardiomyopathy (e.g., hypertrophic cardiomyopathy, multiple myeloma) were likely initial misdiagnoses, as these diagnoses (similar to all diagnoses included here) preceded the ATTR cardiomyopathy diagnosis. Univariate logistic regression was used to calculate odds ratios. *Localized to the connective tissue or soft tissue. AV, atrioventricular; ECG, electrocardiogram; HFrE, heart failure with reduced ejection fraction; HFpEF, heart failure with preserved ejection fraction; SVT, supraventricular tachycardia; VT, ventricular tachycardia.

