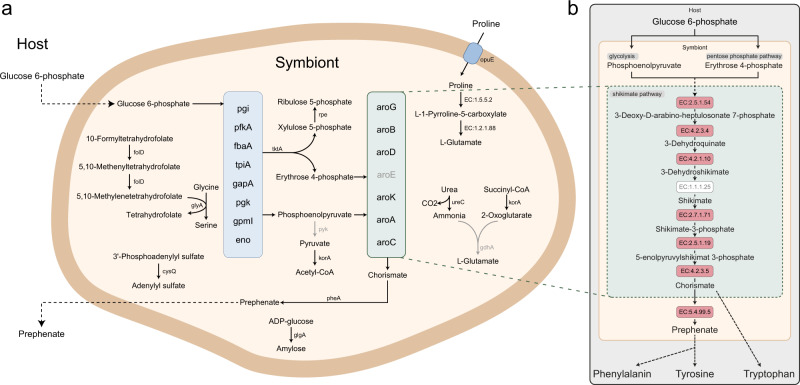
Fig. 2. Metabolism of the symbiont S. silvanidophilus.
a Complete, reconstructed metabolism of S. silvanidophilus, as inferred from genomic data. Enzymes and arrows in gray were missing in the genome annotation. Dashed arrows indicate transport processes without annotated transporters, but which are expected to occur based on observed phenotypes. b Schematic diagram of the shikimate pathway in S. silvanidophilus. Dashed arrows represent multiple enzymatic steps. Red boxes: enzyme present in the genome. White box: enzymes not annotated in the genome, but reaction probably catalyzed by another enzyme.

