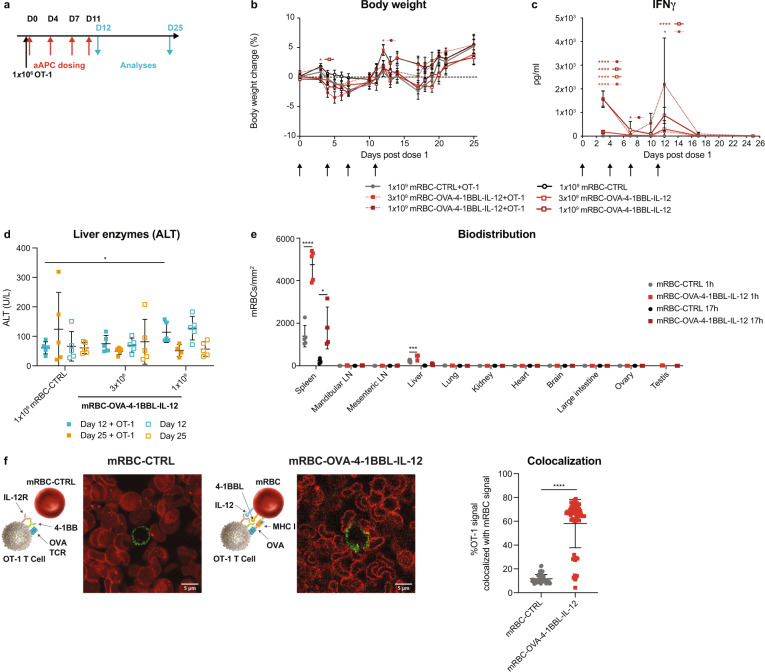
Fig. 2. mRBC-OVA-4-1BBL-IL-12 was well tolerated, with preferential biodistribution to the spleen to facilitate T-cell interaction.
a CD45.1 Pep Boy mice (n = 10) were treated with 1 × 10⁶ naïve OT-1 cells or left untreated, and either dosed with 1 × 10⁹ mRBC-CTRL or a dose titration of mRBC-OVA-4-1BBL-IL-12 (1 × 10⁹, 3 × 10⁸) on days 0, 4, 7, and 11. n = 5 were killed on day 12, with n = 5 measured for time points post day 12 for all groups except for n = 4 for mRBC-OVA-4-1BBL-IL-12+OT-1. b Body weight changes compared to day 0. Two-way ANOVA compared to mRBC-CTRL; day 3: 1 × 10⁹ P = 0.019; day 12: 1 × 10⁹ + OT-1 P = 0.048. c Plasma IFNγ levels over time. n = 10 for days 3 and 7; n = 5 post day 10 except for n = 4 for mRBC-OVA-4-1BBL-IL-12+OT-1 on days 17 and 25. Two-way ANOVA compared to mRBC-CTRL; day 3: 3 × 10⁸ and 1 × 10⁹ P < 0.0001, 3 × 10⁸ + OT-1 P = 0.0002, 1 × 10⁹ + OT-1 P < 0.0001; day 7: 3 × 10⁸ + OT-1 P = 0.018; day 12: 3 × 10⁸ + OT-1 P = 0.025, 1 × 10⁹ P < 0.0001. d Serum ALT levels on days 12 and 25. One-way ANOVA compared to mRBC-CTRL; day 12: 1 × 10⁹ + OT-1 P = 0.023. e CD45.1 Pep Boy mice (n = 5) were transferred with 2 × 10⁶ naïve CellTrace Yellow dye-labeled OT-1 cells before dosing with 1 × 10⁹ CellTrace Far Red dye-labeled mRBC-CTRL or mRBC-OVA-4-1BBL-IL-12. Fluorescently-labeled mRBCs per tissue area by immunofluorescent analyses at 1 h or 17 h post mRBC injection. One-way ANOVA compared to mRBC-CTRL; spleen: 1 h P < 0.0001, 17 h P = 0.022; liver: 1 h P = 0.0006. f Representative frame of confocal live cell imaging analyses of activated OT-1 cells (green) landing onto a layer of immobilized CellTrace Far Red dye-labeled mRBC-CTRL cells or mRBC-OVA-4-1BBL-IL-12 that were conjugated with DL650-labeled 4-1BBL protein (red). Mander’s colocalization coefficient was used to quantify percent of OT-1 signal which overlaps with mRBC signal in each frame (mRBC-CTRL: n = 54 frames; mRBC-OVA-4-1BBL-IL-12: n = 58 frames) of the live cell imaging video. Unpaired two-sided Student’s t-test; P < 0.0001. Data are depicted as mean ± s.d. and are representative of two independent experiments. Source data are provided as a Source Data file.

