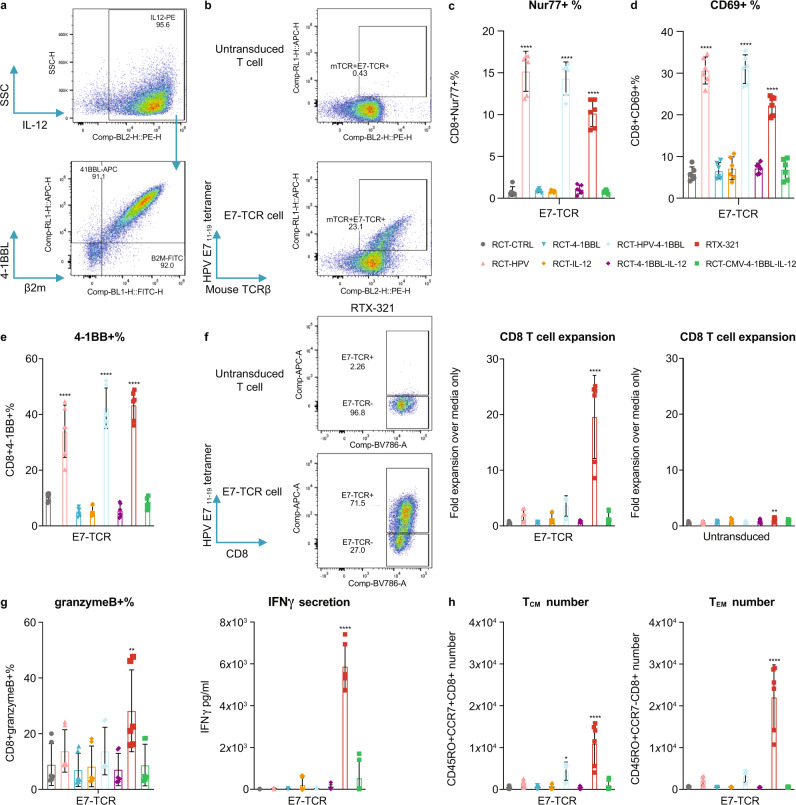
Fig. 6. RTX-321 drives primary antigen-specific T-cell expansion, activation, memory differentiation, and effector function in vitro.
a RTX-321 expression by anti-IL-12, anti-4-1BBL, and anti-β2M staining. b Representative flow plots showing TCR expression of E7-TCR cells compared with untransduced T cells before co-culture. c–h E7-TCR cells (duplicates from three donors) were incubated with RCT-CTRL, RCT-HPV, RCT-4-1BBL, RCT-IL-12, RCT-HPV-4-1BBL, RCT-4-1BBL-IL-12, RTX-321, or RCT-CMV-4-1BBL-IL-12. The Nur77+% at 2 h (c), CD69+% at 24 h (d), and 4-1BB+% on day 5 (e) of E7-TCR cells. f Representative flow plots showing E7-TCR+ expression of RCT-CTRL- and RTX-321-treated E7-TCR cells on day 5. Fold expansion of E7-TCR cells and untransduced CD8+ T cells over media-treated controls on day 5. g The granzyme B+ % of E7-TCR cells on day 1 and IFNγ concentration in the supernatant on day 5. h TCM and TEM of E7-TCR cell numbers on day 5. One-way ANOVA compared to RCT-CTRL; Nur77+% (c), CD69+% (d), and 4-1BB+% (e): RCT-HPV, RCT-HPV-4-1BBL, or RTX-321 P < 0.0001; CD8 T-cell expansion (f): RTX-321 E7-TCR P < 0.0001, untransduced P = 0.0062; granzymeB+% (g): RTX-321 P = 0.0021; IFNγ secretion (g): RTX-321 P < 0.0001; TCM number (h): RCT-HPV-4-1BBL P = 0.011, RTX-321 P < 0.0001; TEM number (h): RTX-321 P < 0.0001. Data are depicted as mean ± s.d and are representative of two independent experiments. Source data are provided as a Source Data file.

