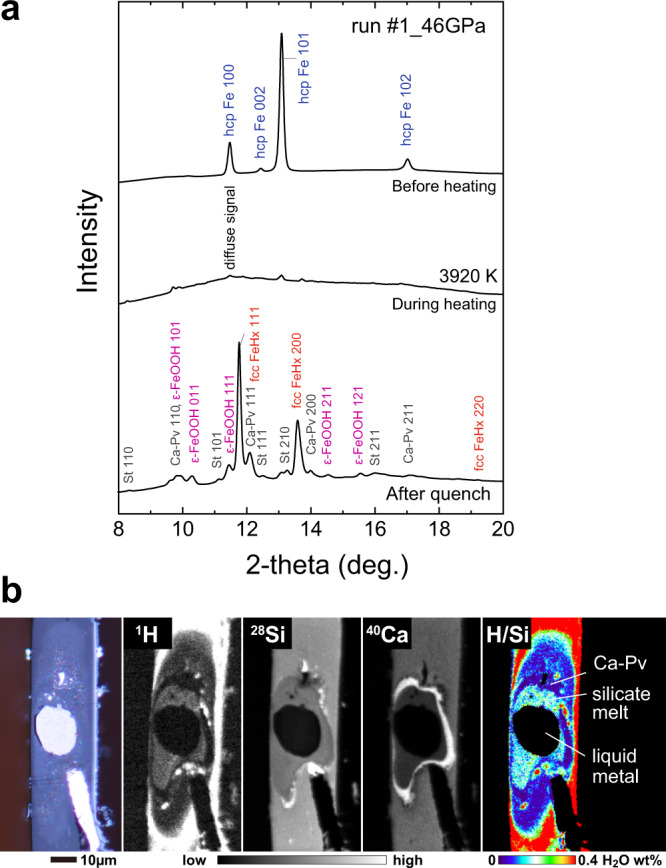
Fig. 1. Analyses of hydrogen in metal and silicate.

a XRD patterns collected before/during/after heating to 3920 K at 46 GPa in run #1. Both iron and silicate were molten at the center of a laser-heated spot during heating. Hydrogen concentration in liquid metal was obtained from those in fcc FeHX and ε-FeOOH. b Photomicrograph (left), secondary ion images for 1H+, 28Si+, and 40Ca+ (middle), and a distribution map of water (right). Note the absence of hydrogen in metal because it escaped from iron upon releasing pressure. Hydrogen (water) content in quenched silicate melt was obtained with ±2% to ±7% relative uncertainty.
