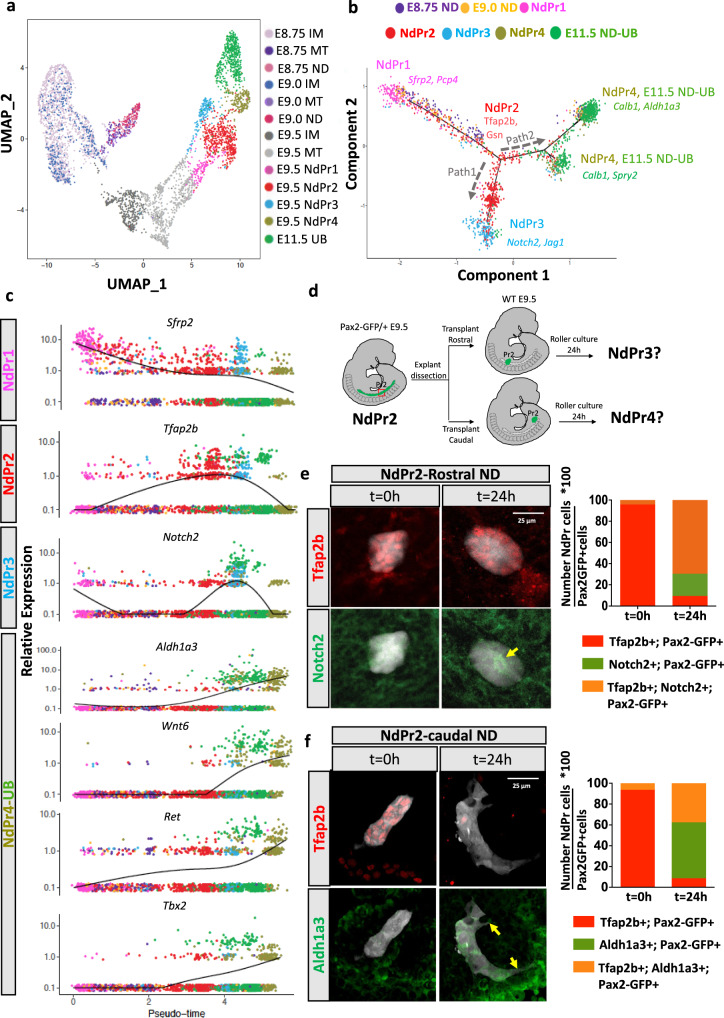
Fig. 4. Developmental trajectory of nephric duct progenitors by single cell RNA-seq and transplantation assays.
a Uniform Manifold Approximation and Projection (UMAP) analysis of intermediate mesoderm (IM), mesonephric tubules (MT), nephric duct (ND, NdPr) and ureteric bud (UB) single cell RNA-seq libraries at E8.75, E9.0, E9.5 and E11.5. Cells are color coded by time point and cell type. b Principal component analysis plot identifies state transitions between nephric duct progenitor (NdPr) populations at different time point during ND development and the trajectory of cell type differentiation (depicted by black arrows). The trajectory was constructed based on the top 10 NdPr markers. c Representative expression profile of the selected NdPr cluster markers in pseudotime. Cells are color coded by NdPr type and time point, as in (b). d Schematic representation of the tissue transplantation procedure used to assess the developmental potential of NdPr2 cells. e Analysis of the developmental potential of NdPr2 rostral grafts. Left panel shows immunofluorescence staining of the NdPr2 marker Tfap2b and the NdPr3 marker Notch2 in rostral grafts (Pax2-GFP positives) at t = 0 h and 24 h after transplantation. Right panel shows the quantification of the percentage of NdPr2 (Tfap2b + ), NdPr3 (Notch2 + ) or double positive cells in n = 3 (t = 0 h) and n = 3 (t = 24 h) explants. Source data are provided as a Source Data file. f Analysis of the developmental potential of NdPr2 caudal grafts. Left panel shows immunofluorescence staining of the NdPr2 marker Tfap2b and the NdPr4 marker Aldh1a3 in caudal grafts (Pax2-GFP positives) at t = 0 h and 24 h after transplantation. Right panel shows the quantification of the percentage of NdPr2 (Tfap2b + ), NdPr4 (Aldh1a3 + ) or double positive cells in n = 5 (t = 0 h) and n = 4 (t = 24 h) explants. Scale bar 25 μm for all pictures.

