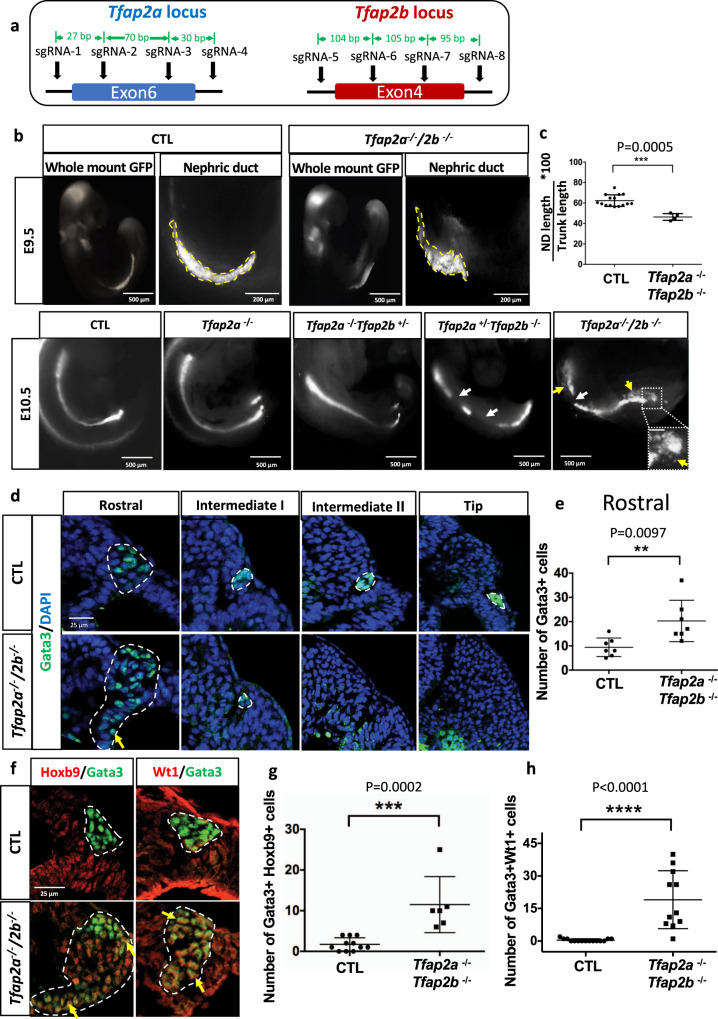
Fig. 6. Inactivation of Tfap2a and Tfap2b by CRISPR/Cas9 leads to defects in nephric duct morphogenesis and progenitor cell identity.
a Schematic representation of Tfap2a and Tfap2b exons targeted by CRISPR/Cas9 technology and the location of the sgRNAs used. b Wholemount GFP fluorescence of control (Pax2-GFP) and allelic series of Tfap2a/2b;Pax2-GFP mutant embryos at E9.5 and E10.5. White arrows denote nephric duct integrity defects whereas yellow arrow and inset magnification highlight ectopic Pax2-GFP positive cells. Scale bar of the inset = 50 μm. c Quantification of nephric duct (ND) elongation in Tfap2a/2b;Pax2-GFP double KO embryos at E9.5. n = 15 (Control) and n = 4 (Tfap2a/2b double KO) biologically independent samples. The graphs represent mean ± SD, assessed by a two-tailed Mann–Whitney test. Source data are provided as a Source Data file. d Immunostaining for the nephric duct marker Gata3 in transverse sections of E9.5 Tfap2a/2b double mutant shows an elongation defect and the presence of ectopic Gata3 positive (nephric duct) cells (yellow arrows). Nephric duct cells are denoted by white dotted lines. Scale bar 25 μm for all pictures. e Quantification of Gata3+ cells in the rostral region of E9.5 control and Tfap2a/2b double KO embryos (n = 7). The graph represents mean ± SD, determined by a two-tailed unpaired t-test. Source data are provided as a Source Data file. f Immunostaining for the markers Hoxb9 (NdPr1), and intermediate mesoderm (Wt1) in transversal sections of the nephric duct in E9.5 control and Tfap2a/2b double mutant embryos. Yellow arrows denote Gata3 positive cells expressing Hoxb9 or Wt1 markers. White dotted lines denote the nephric duct. Scale bar 25 μm for all the pictures. g Quantification of Hoxb9+,Gata3+ cells number in sections of E9.5 control and Tfap2a/2b double KO embryos. n = 11 (Control) and n = 6 (Tfap2a/2b double KO) independent sections from four different embryos per genotype. h Quantification of the number of Wt1+,Gata3+ cells in sections of E9.5 control and Tfap2a/2b double KO embryos. n = 15 (Control) and n = 11 (Tfap2a/2b double KO) independent sections from four different embryos per genotype. The graphs represent mean ± SD, compared by a two-tailed Mann–Whitney test. Source data are provided as a Source Data file.

