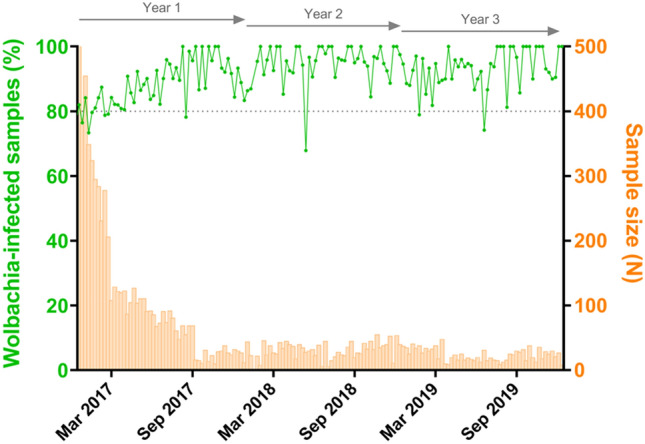
Figure 3.

Post-release establishment of Wolbachia in Jurujuba. Following egg-release cessation in Jurujuba, Wolbachia-infection was monitored over the following three years, during which a self-sustained field establishment was observed. Infection indexes (%) are observed as line-connected dots (green), following the vertical left axis, whereas the sample sizes are plotted as histograms (orange), following the vertical right axis. The horizontal axis denotes time (weeks), with ticks scaled for 6-month bins. Top arrows mark yearly post-release periods. The dashed line, positioned at the 80% index mark, denotes a threshold for high-percent infection. This graph was generated in GraphPad Prism 8 (https://www.graphpad.com).
