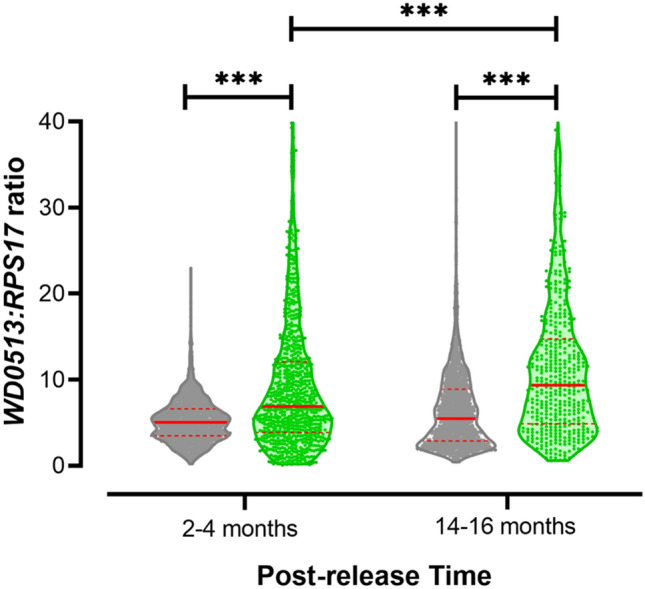
Figure 4.

Wolbachia whole-body density increases subsequent to field establishment. Wolbachia whole-body density was molecularly assayed in whole-body extracts from colony (grey) and Jurujuba samples (green), collected over the post-release phase. Density or titration levels (vertical axis) are relative quantification indexes, reflecting the copy number ratio between wMel WD0513 and the endogenous ribosomal maker RPS17. Data were aggregated in 12-weeks pools and represented by violin plots, with medians and quartiles in solid and dashed red lines, respectively. Statistical inferences were performed by the non-parametric Kruskal–Wallis test followed by Dunn’s post-hoc multiple comparisons. Asterisks highlight differences between groups, considering a significance level (α) equal to 0.05, and its numbers reflects probability ranges: *P < 0.05, **P < 0.01, ***P < 0.001. Graph and statistics were made with GraphPad Prism 8 (https://www.graphpad.com).
