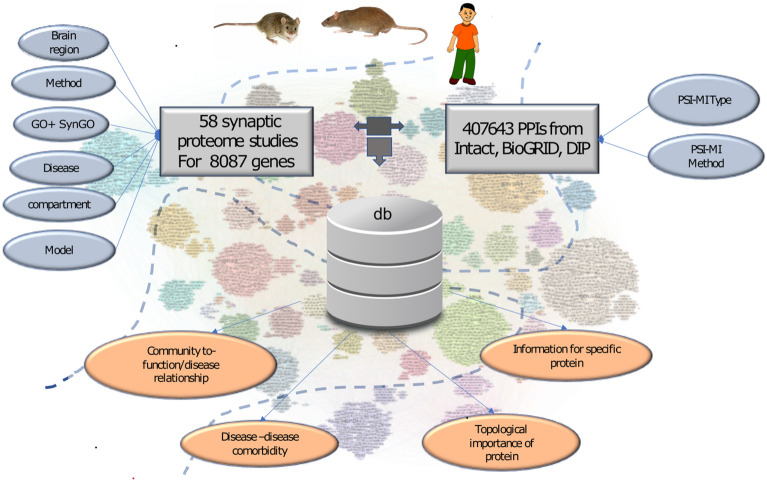
Figure 2.
Structure of the SQLite database, which includes 58 synaptic studies covering 8087 unique genes and 407,643 direct protein interactions. Grey ovals on the top show the annotated metadata: left—for nodes/ genes, which include brain region, subcellular compartment, method of extraction, disease and GO function annotation and link to published quantitative models; right—for edges/PPIs, which include PSI-MI type and method. The orange ovals in the bottom illustrate the possible outcomes of the database, including: (1) information for specific protein/gene, and (2) information that could be obtained from PPI network, e.g., protein’s topological importance, community to disease relationship, and disease-disease comorbidity. The database is available as a Supplementary File and from Edinburgh DataShare https://doi.org/10.7488/ds/3017.

