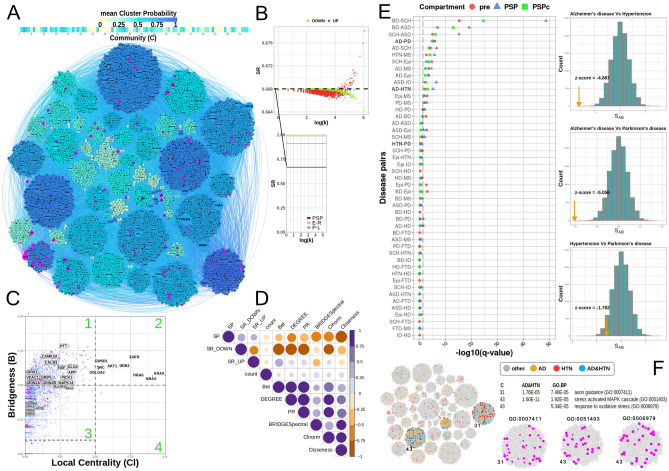
Figure 3.
(A) Community structure of the PSP network using the Spectral modularity method. Communities are coloured using the average gene-community probability values: bluer coloured a community is, the more probable the genes are of belonging to that community on average. Nodes coloured magenta highlight the core PSD95 interactors25, which is also highlighted magenta in the Bridgeness plot in (C). (B) Graph entropy plots: (main) Global graph entropy rate (SR) plot comparing the structure of the PSP network (0.668) against 1000 randomised Erdos–Renyi (E–R = 0.989 + − 0.0005) and Power–Law (P–L = 0.9127 + − 0.0032, αPSP = 2.41) models of similar size, (Enlarged) Evidence for scale-free structure in PSP network using a perturbation analysis (10], plotted is the SR values after each protein is perturbed through over-expression (SR_UP = red) and under-expression (SR_OWN = green), against the log of the proteins degree,. (C) Bridging proteins, estimated using the Spectral clustering algorithm are plotted against semi-local centrality (Methods), allowing their categorisation: Region 1, proteins having a 'global' rather than 'local' influence in the network (also been called bottle-neck bridges, connector or kinless hubs12 (DLG4, GRIN2B, CAMK2A, etc.). Region 2, proteins having 'global' and 'local' influence (EGFR, HRAS, NRAS, etc.). Region 3, proteins centred within the community they belong to, but also communicating with a few other specific communities (GRIN1, GRIA2-4). Region 4, proteins with 'local' impact , primarily within one or two communities (local or party hubs9. (D) Correlation plot for different centrality measures estimated for PSP network.: SP - a protein’s shortest path value, SR_UP-Entropy rate when protein is over expressed, SR_DOWN—entropy rate when protein is under expressed, COUNT - number of protein identifications in the studies, Bet - protein’s betweenness centrality value, Degree—protein degree, PR- Page Rank, BRIDGESpectral —protein Bridgeness value, CNorm - Protein’s local centrality value, Closeness - protein’s closeness value; correlation between SR_UP and Bridgeness indicates that genes with higher Bridgeness values also lower the graphs entropy when active/overexpressed, which allows the signal to pass more freely (Supplementary Table 2). (E) left: Disease-disease relationship for presynaptic (red) and PSD full (blue) and PSD consensus (green) interactome. Where significance q-values < 0.05 is delineated by the dashed line. Schizophrenia (SCH), Autistic Spectrum Disorder (ASD), Autistic Disorder (AUT), Bipolar Disorder (BD), Intellectual Disability (ID), Alzheimer disease (AD), Epilepsy Syndrome (Epi), Parkinson's Disease (PD), Frontotemporal Dementia (FTD), Huntington's Disease (HD) and Multiple Sclerosis (MS) are considered; right: randomisation studies for disease-disease pairs overlap, yellow arrow shows the measured value of Z-score compared to 10,000 AD-HTN, PD-HTN and AD-PD random models. (F) Colocalization of AD and HTN on the PSP network by propagating these gene-disease associations (GDA) through the network using the Belief Propagation DC-SBM algorithm13. The colocalization of AD and HTN shared common molecular pathways in communities 31 and 43, which were also found enriched for axon guidance, stress-activated MAPK cascade and response to oxidative stress GO BP terms.

