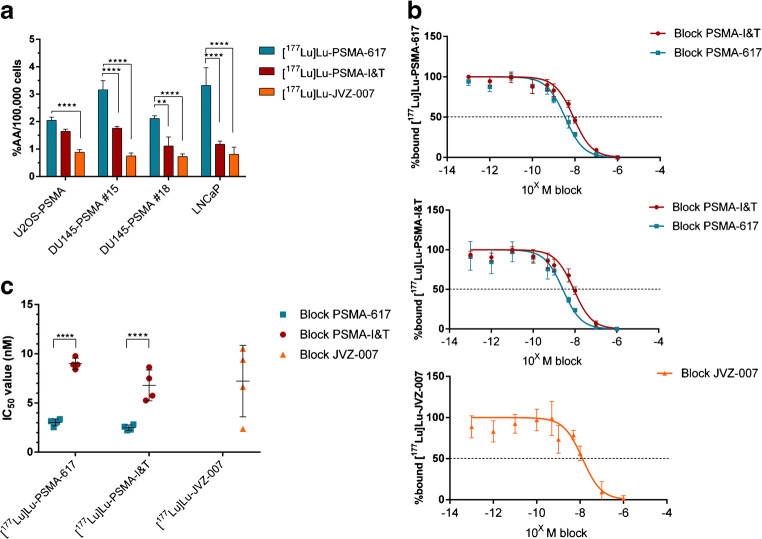
Fig. 1.
In vitro uptake determining binding and IC50 values of lutetium-177-labeled PSMA-617, PSMA-I&T, and nanobody JVZ-007. a Uptake (expressed in percentage of the added activity (%AA)) of the different tracers per 100,000 cells in four PSMA-expressing cell lines. b IC50 curves of in vitro displacement assays using DU145-PSMA #15 cells (IC50 curves of the other three cell lines can be found in the supplemental data (Suppl. Fig. 1)) c IC50 values of all in vitro uptake assays, each dot represents a different PSMA-expressing cell line. The error bars represent the standard deviation. Asterisks indicate significance (**P ≤ 0.01, ****P ≤ 0.0001)

