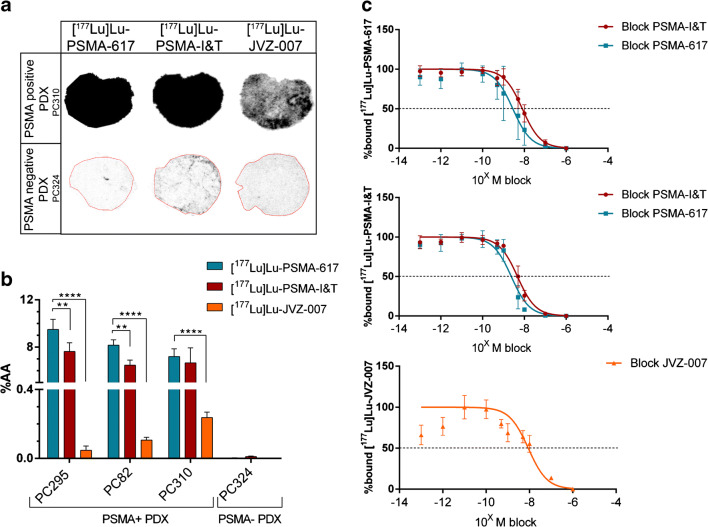
Fig. 2.
In vitro autoradiography assays determining binding and IC50 values of lutetium-177-labeled PSMA-617, PSMA-I&T, and nanobody JVZ-007. a Representative images of the autoradiography results on PC310 (PSMA-positive) and PC324 (PSMA-negative) PDX. b Quantification of the autoradiography results representing the total binding (percentage added activity (%AA)) of the radiotracers on PSMA-positive and PSMA-negative PDXs. c IC50 curves of autoradiography displacement assays using the PC295 PDX. The error bars represent the standard deviation. Asterisks indicate significance (**P ≤ 0.01, ****P ≤ 0.0001)

