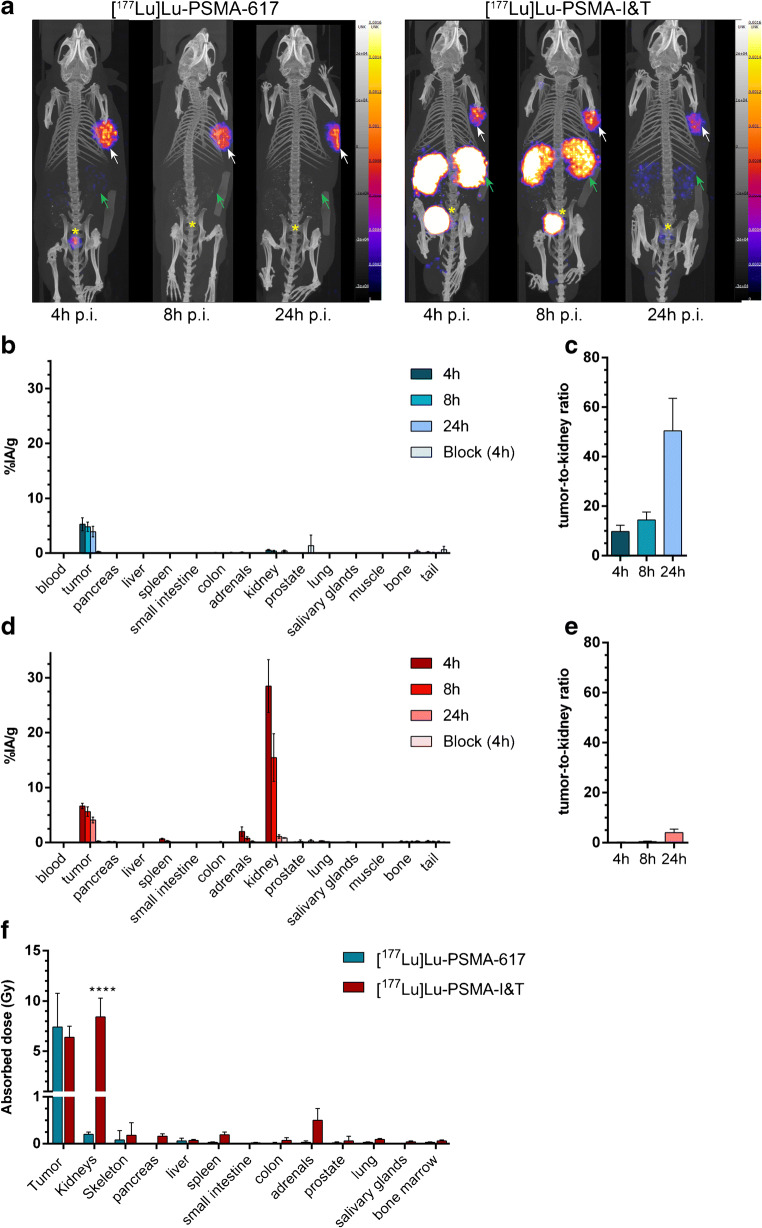
Fig. 4.
In vivo biodistribution of [177Lu]Lu-PSMA-617 and [177Lu]Lu-PSMA-I&T in mice bearing PC295 PDX. a Representative SPECT/CT images at 4, 8, and 24 h p.i. White arrows indicate the PC295 PDX, green arrows the kidneys, and the yellow asterisks indicate the bladder. b Biodistribution of [177Lu]Lu-PSMA-617 (expressed in percentage of injected activity per grams of tissue (%IA/g)) and c corresponding tumor-to-kidney ratio (error bars indicate standard deviation). d Biodistribution of [177Lu]Lu-PSMA-I&T and e corresponding tumor-to-kidney ratio (for a–d: error bars indicate standard deviation). f Absorbed dose per 30 MBq (error bars indicate standard error of the mean). Asterisks indicate significant differences between tracers (****P ≤ 0.0001)

