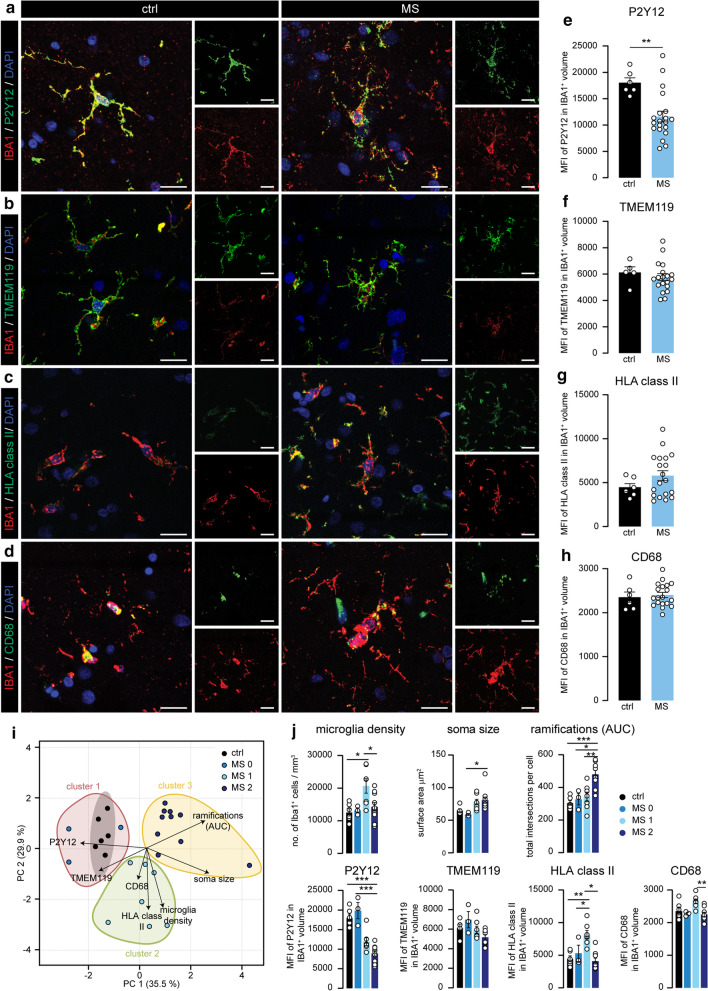
Fig. 2.
Differential expression of microglial markers in MS cortex corresponds with morphological changes. a–d Representative images displaying P2Y12 (a), TMEM119 (b), HLA class II (c) and CD68 (d) expression in IBA1+ microglia in cortical layer 3 of ctrl and MS donors. e–f. Quantification of the mean fluorescence intensity of P2Y12 (e), TMEM119 (f), HLA class II (g) and CD68 (h) in microglia. i. Scores for the first and second principle component (PC1/PC2) of ctrl and MS cases. Subjects are coloured according to their K-means cluster assignment. j Quantification of microglia density, microglia soma size, Sholl-derived area under the curve, mean fluorescence intensity of P2Y12, TMEM119, HLA class II and CD68 in IBA1+ volume in the different subgroups. Individual datapoints indicate averaged data from an individual donor, columns and error bars show mean ± SEM; *p < 0.05, **p < 0.01, ***p < 0.001; n = 6 ctrls, except in (f) where n = 5 ctrls, n = 20 MS subjects; Scale bars = 20 µm

