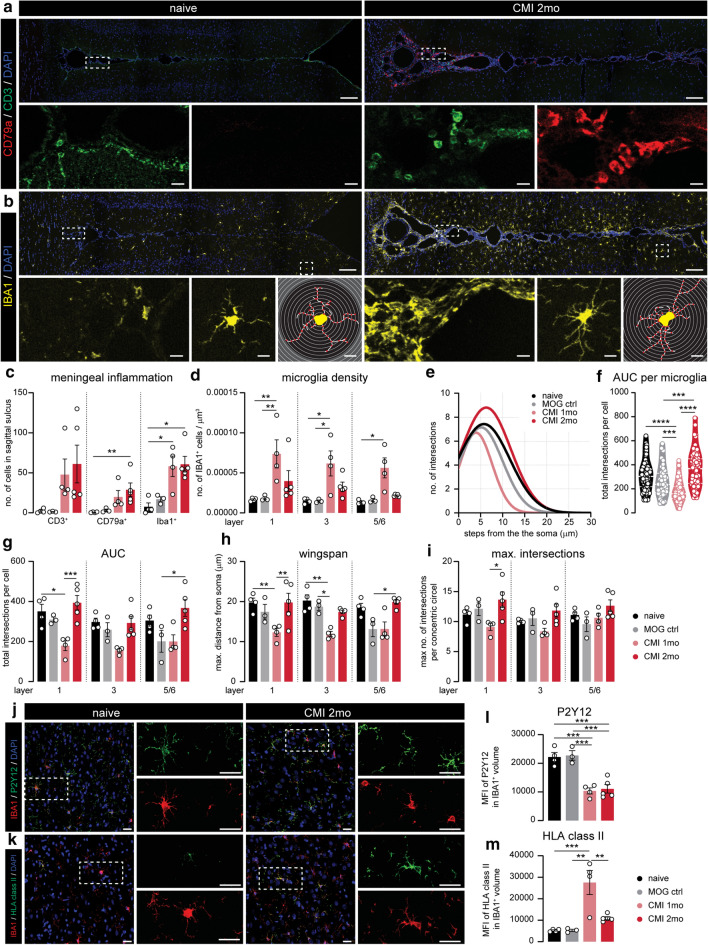
Fig. 4.
Experimental chronic meningeal inflammation induces similar microglial phenotypes as in MS cortex at different time points. a Representative image of CD3 (T cells) and CD79a (B cells) expression of the sagittal sulcus and surrounding cortex of naive and CMI 2 months animals. b Representative images of IBA1 expression in and around the sagittal sulcus of naïve and CMI 2 month rats (top panels). Higher magnification images of IBA1 expression inside the meninges (lower panel—left). Close-up of a single IBA1+ cell (lower panel—middle) and corresponding traced outline (lower panel—right). c Absolute number of CD3+ T cells, CD79a+ B cells and IBA1+ cells in the sagittal sulcus. d Microglial density per cortical layer, quantified as the number of IBA1+ cells per mm3 in the different animal groups e. Non-linear curve fit of the average number of microglial branch intersections per 0.3 µm step from the cell soma per cortical layer as measured by the Sholl analysis. f. Total Sholl-derived area under the curve (AUC) of individual microglia. g–i Different measurements (AUC, wingspan, maximal number of intersections) of microglial cell morphology averaged per animal. j, k. Representative confocal images of cortical layer 3 from naïve and CMI 2 months displaying P2Y12 (j) or HLA class II (k) and IBA1 expression. i, m Mean fluorescence intensity of P2Y12 signal (i) and HLA class II (m) in IBA1+ volume. Individual datapoints indicate averaged data from an individual donor (c–e, g–i, l, m) or individual microglia (e), columns and error bars show mean ± SEM; *p < 0.05, **p < 0.01, ***p < 0.001; n = 4 naïve, n = 3 MOG ctrl, n = 4 CMI 1mo, n = 5 CMI 2 months (c–e, g–i, l, m), n = 112 naïve, n = 43 MOG ctrl, n = 173 CMI 1 month, n = 143 CMI 2 months (f); Scale bars = 100 µm (top panels of a, b), 10 µm (lower panels of a, b), 25 µm (j, k)

