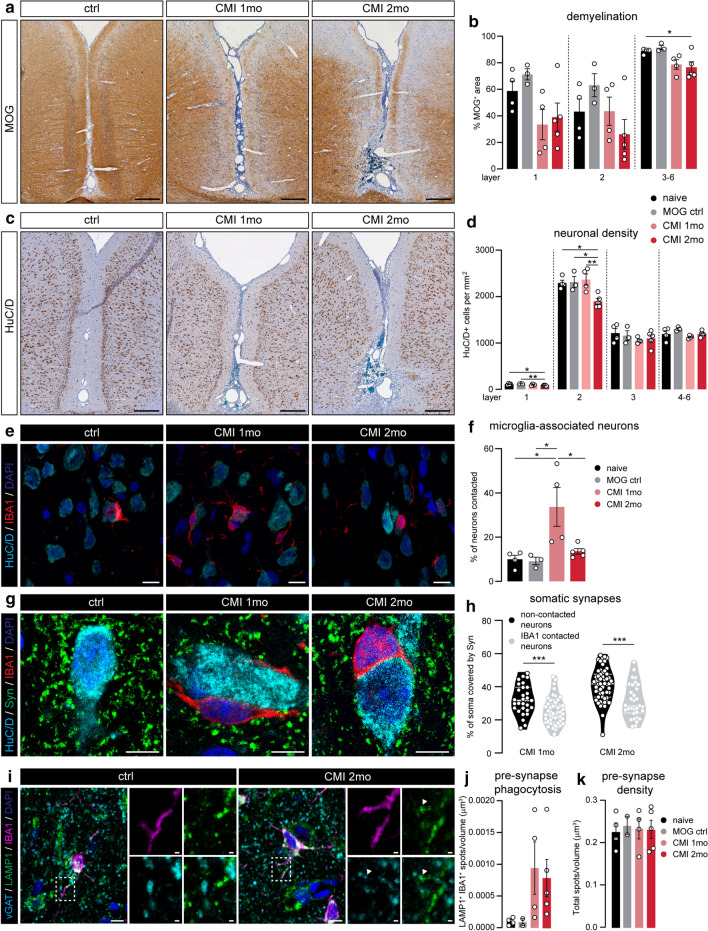
Fig. 6.
Experimentally induced chronic meningeal inflammation recapitulates cortical pathology in the MS cortex. a Representative images of MOG-stained cortex around the sagittal sulcus of naive, CMI 1 month and CMI 2 months animals. b Quantification of the percentage of MOG+ pixels in cortical layers 1, 2 and 3–6 surrounding the sagittal sulcus in the four groups of rats. c Representative images showing HuC/D+ neurons in the cortex of naive, CMI 1 month and CMI 2 months animals. d Quantification of neuronal density in the different cortical layers. e Representative maximum projection confocal images of cortical layer 3 from naive, CMI 1 month and CMI 2 months animals double-labelled with IBA1 (microglia) and HuC/D (neurons). f Quantification of the percentage of neuronal somata directly in contact with microglia soma in cortical layer 3. g Representative single z-plane confocal images of cortical layer 3 of naive, CMI 1 month and CMI 2 months animals immunolabelled for HuC/D (neuronal somata), IBA1 (microglia) and Synaptophysin (pre-synapses). h Quantification of the percentage of neuronal soma covered by Synaptophysin-labelled structures in microglia-contacted neurons and neurons not associated with microglia in CMI animals (pooled data from 3 animals in each group). i Representative images of IBA1 (microglia), LAMP1 (lysosomes) and vGAT (pre-synapses) expression in cortical layer 3 of a naive and CMI 2 months animal. j Quantification of the density of vGAT+ spots in microglial lysosomes of cortical layer 3. k Total density of vGAT spots in layer 3 of the cortex. Individual datapoints indicate averaged data from an individual animal (b, d, f, h, j, k), or individual neurons (h), columns and error bars show mean ± SEM; *p < 0.05, **p < 0.01, *** p < 0.001; n = 4 naïve, n = 3 MOG ctrl, n = 4 CMI 1 month, n = 5 CMI 2 months (b, d, f, h, j, k) with the exception of n = 2 MOG ctrl in (j, k), n = 80 CMI 1mo and n = 88 CMI 2 months neurons (h). Scale bars = 250 µm (a, c), 10 µm (e, g)

