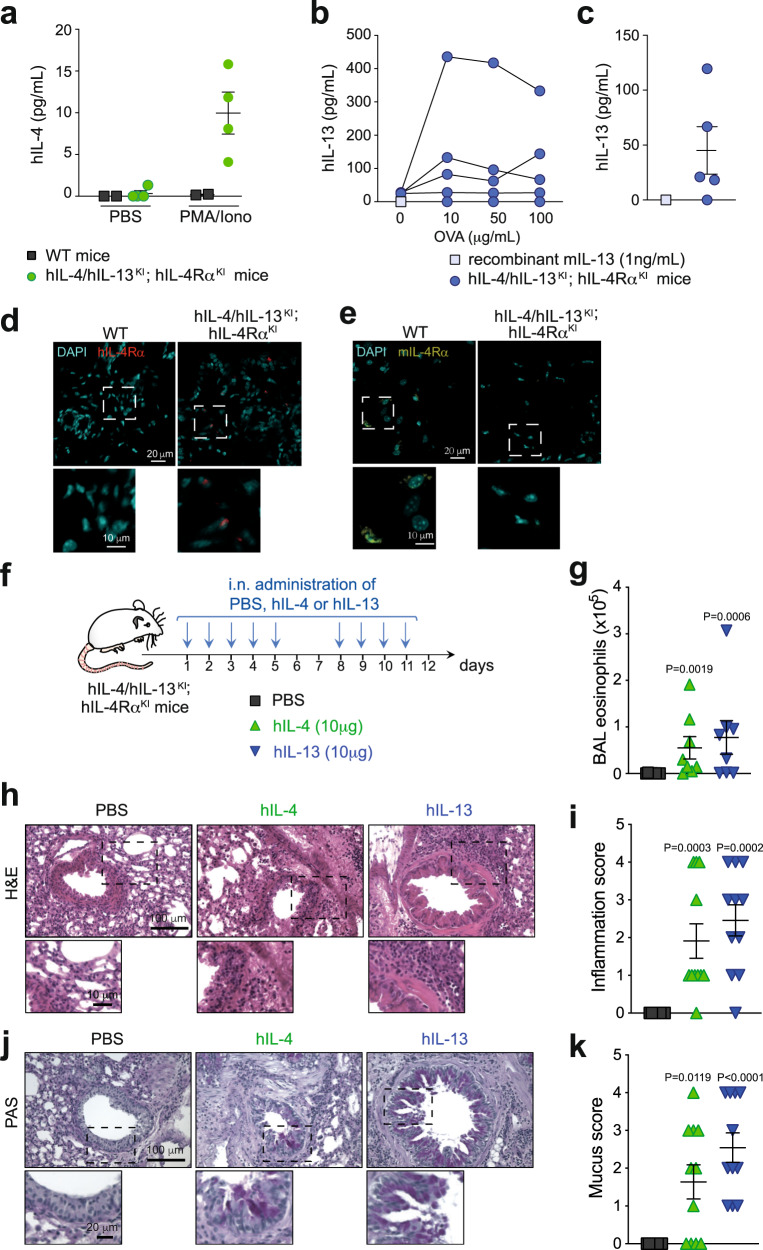
Fig. 4. Characterization of hIL-4/hIL-13KI; hIL-4RαKI humanized mice.
a hIL-4 levels in the supernatant of splenocytes from n = 2 WT or n = 4 hIL-4/hIL-13KI; hIL-4RαKI humanized mice stimulated ex vivo with PMA (20 nM) b hIL-13 levels in the supernatant of splenocytes from hIL-4/hIL-13KI; hIL-4RαKI mice sensitized with ovalbumin (OVA), and stimulated ex vivo with OVA (n = 5 mice). c hIL-13 levels in BAL fluid from hIL-4/hIL-13KI; hIL-4RαKI mice sensitized and challenged with OVA (n = 5 mice). Samples were collected 24 h after the last OVA challenge. Data in a–c show values from individual mice with bars indicating mean ± SD (in a and c). d, e Representative staining of skin samples from WT or hIL-4/hIL-13KI; hIL-4RαKI mice with anti-mouse IL-4Rα (d) or the anti-human IL-4Rα mAb dupilumab (e) and DAPI. Staining skin sample are representative from three WT and six hIL-4/hIL-13KI; hIL-4RαKI mice from two separate experiments. f Protocol outline. hIL-4/hIL-13KI; hIL-4RαKI mice were challenged nine times intranasally with 10 μg recombinant hIL-4, hIL-13, or PBS as a control. g Eosinophil numbers in BAL fluid 24 h after the last challenge with hIL-4 or hIL-13. h Representative lung sections stained with hematoxylin and eosin (H&E; revealing leukocyte infiltration), 24 h after the last challenge with hIL-4 or hIL-13. i Scoring of leukocyte infiltration in H&E-stained lung tissue sections. j Representative periodic acid–Schiff (PAS) staining of lung sections, demonstrating mucus-producing goblet cells (dark purple). k Quantification of mucus-producing goblet cells. Data in g, i, and k show values from individual mice with bars indicating mean ± SEM from n = 8 mice per group, pooled from two independent experiments. P values were calculated using two-tailed Mann–Whitney U test. Source data are provided in the Source data file.

