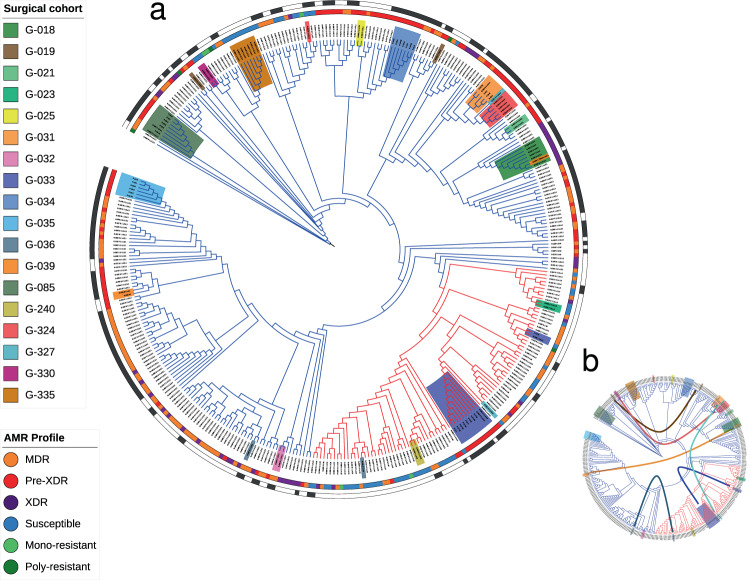
Fig. 2. Phylogenetic diversity in Georgia and identification of polyclonal infections.
a Phylogeny of all Georgian M. tuberculosis isolates included in this study (L2 in blue, L4 in red). Surgery patients are highlighted in different colors. Drug resistance profiles are illustrated in the inner band (see legend) and transmission clusters represented on the outer band were estimated using a 10 SNP phylogenetic distance threshold. Branch lengths and bootstrap values not represented. b Curves connecting patient samples located in distant places of the phylogeny, suggesting polyclonal infections. The phylogeny and associated data can be browsed at the ITOL website (https://itol.embl.de/tree/161111218247381131580915038).

