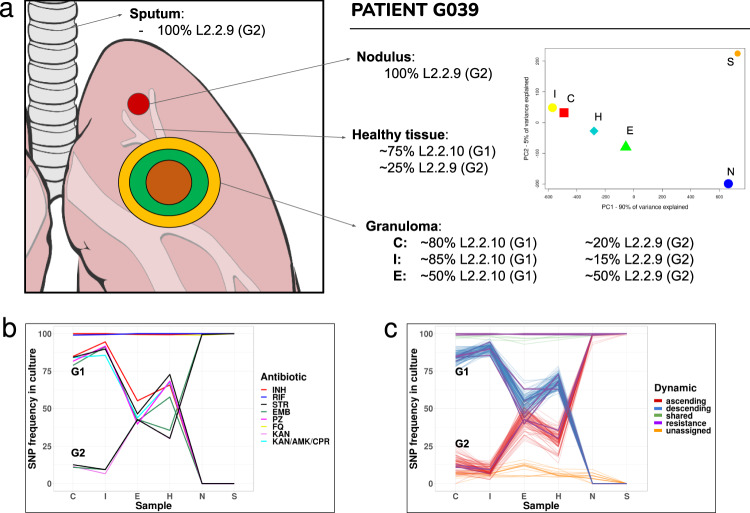
Fig. 3. Dynamics of polyclonal infection with two different strains across the granuloma.
a Descriptive summary of patient G039 genotypes frequencies and distribution across the lesion. The PCA graph illustrates their separation: while the X-axis explains ~90% of the variance, leaving N and S apart from the rest, the Y-axis only explains ~5%, mainly defined by low-frequency variants not shared by N and S (due to reading depth differences). b Antibiotic resistance-associated mutations across surgical and sputum samples for the two co-existing genotypes. c Deconvolution of the two genotypes by frequency patterns clustering. Resistance-associated variants from (b) are represented in purple. Unassigned subpopulations (in orange) are low-frequency variants that we cannot assign to any of the two genotypes and shared fixed variants (in green) are common to both genotypes. C caseum, I inner wall, E external wall, H healthy tissue, N nodule, S sputum. Source data are provided as a Source Data file.

