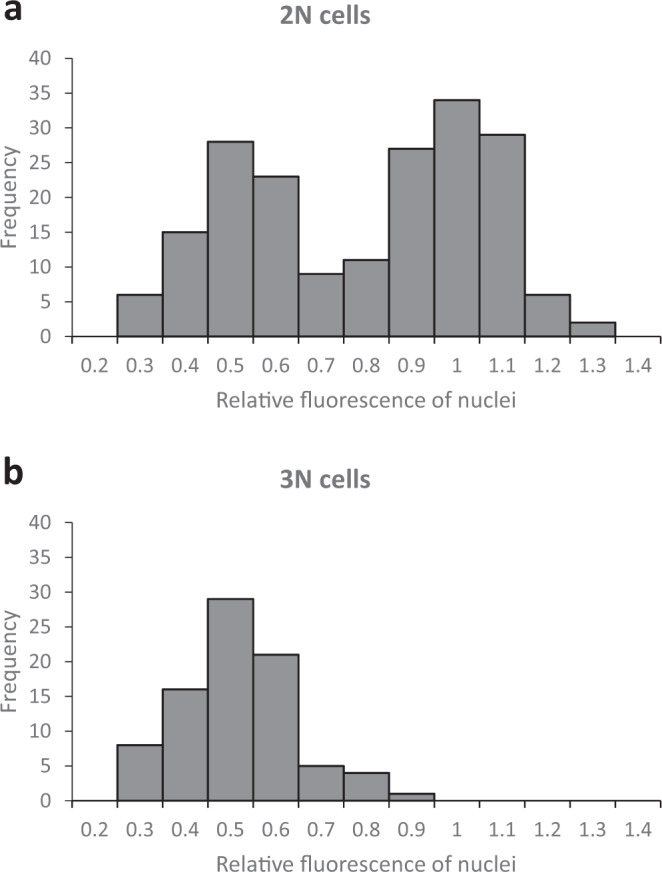
Fig. 5. Ratio of fluorescence intensities of nuclei within individual 2N and 3N cells.

The total fluorescence intensity of each individual nucleus within a cell was measured and the ratio between nuclei in the same cell was determined. For 2N cells (a, n = 190), the ratio of fluorescence intensities of both nuclei in the same cell is shown; for 3N cells (b, n = 42), the ratio of fluorescence intensities of each of the two small nuclei was compared with that of the large nucleus. The figures on the x-axis are the upper bound of each bin; bin size 0.1.
