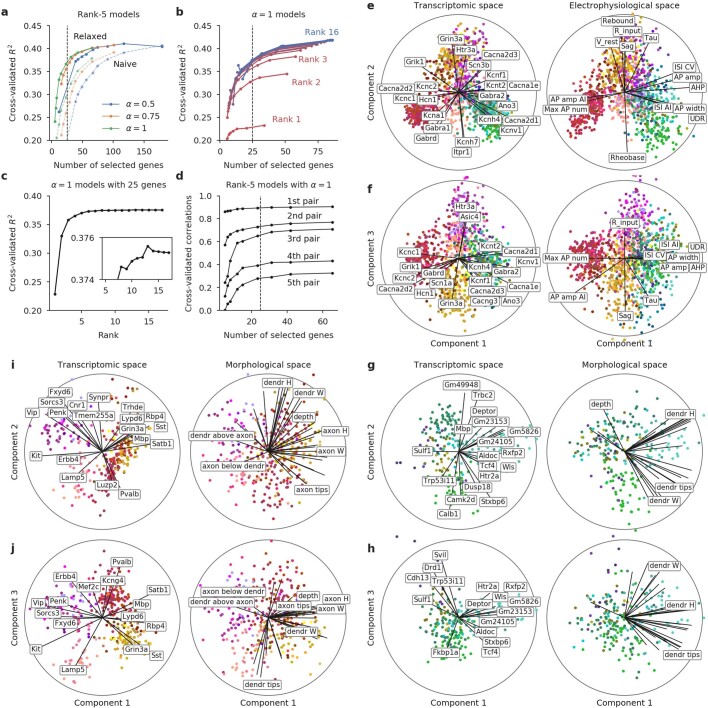
Extended Data Fig. 5. Additional reduced-rank regression analysis and cross-validation.
a, Cross-validated R2 of ‘naive’ and ‘relaxed’ sparse RRR solutions32 for various elastic net penalties (α and λ). ‘Relaxed’ means that the model was re-fit without a lasso penalty using only the selected genes; ‘naive’ means that it was not re-fit. Vertical dashed lines at 25 genes corresponds to the choice made for Fig. 2. The best performance is around ~100 genes, but we chose 25 for the sake of interpretability. The subsequent panels only show results for the ‘relaxed’ models. b, Cross-validated R2 using α = 1 for different ranks from rank 1 to rank 16 (full rank). c, Cross-validated R2 using α = 1 and λ needed to obtain 25 genes for different ranks. The peak performance is achieved with rank ~13 (inset), but rank-5 model used in the main text is almost as good. d, Cross-validated correlations between sequential projections of the transcriptomic and electrophysiological data sets (rank-5 models with α = 1). For any given number of selected genes, correlations decrease monotonically for higher components. e, f, Reduced-rank regression model using only ion channel genes. A full analogue of Fig. 2 but using only 328 ion channel genes (see Methods), of which 307 were detected in our data set in at least 10 cells. g–j, Reduced-rank regression model predicting morphological features. An analogue of Fig. 2 but using morphological, instead of electrophysiological features. The analysis was done separately for the excitatory (g–h) and for the inhibitory (i–j) neurons because different sets of morphological features were computed for these sets of neurons. Excitatory neurons: 269 cells, 35 features. Rank-5 model, λ = 0.59, adjusted to yield 25 genes. Only a subset of morphological features are labelled to reduce the clutter (abbreviations: “W” — width, “H” — height). Inhibitory neurons: 367 cells, 50 features, λ = 0.49.

