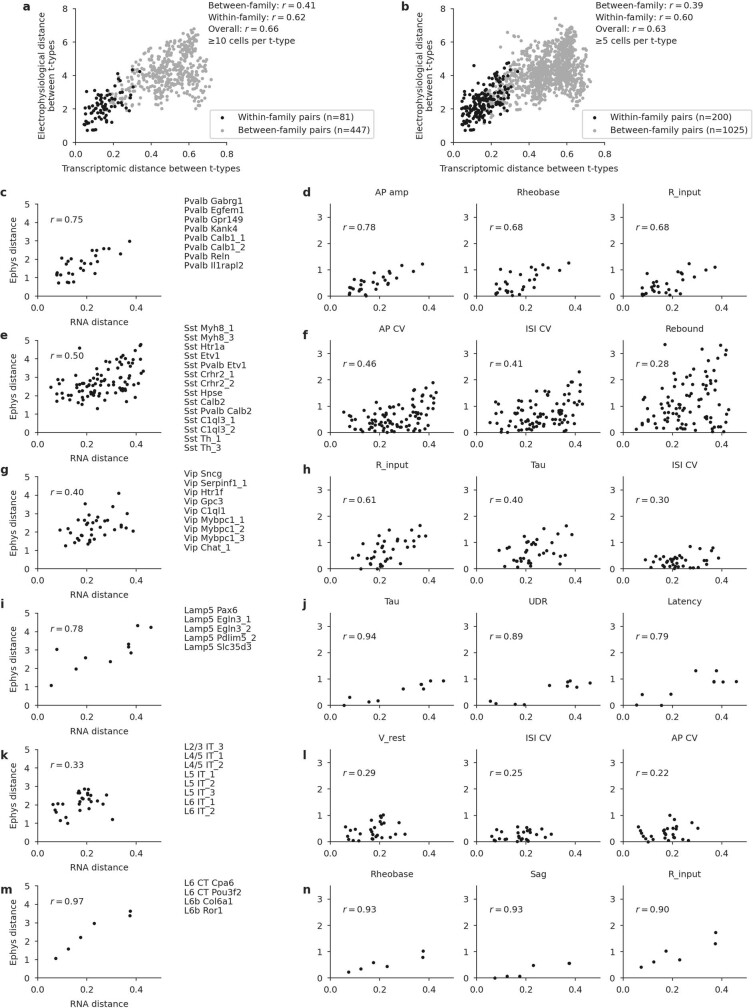
Extended Data Fig. 7. Transcriptomic and electrophysiological distances within individual families.
a, b, Pooled within-family analysis. The same analysis as in Fig. 4c but showing within-family as well as between-family pairs of t-types. Using a cutoff of at least 10 neurons per t-type (a) and a cutoff of at least 5 neurons per t-type (b). c–n, Transcriptomic and electrophysiological distances within individual families. Only t-types with ≥ 5 neurons are used for this analysis (used t-types are listed in the second column). Transcriptomically well-isolated Sst Chodl and Pvalb Vipr2_2 were excluded. Three electrophysiological features with the highest correlation to the transcriptomic distance are shown on the right, for each family.

