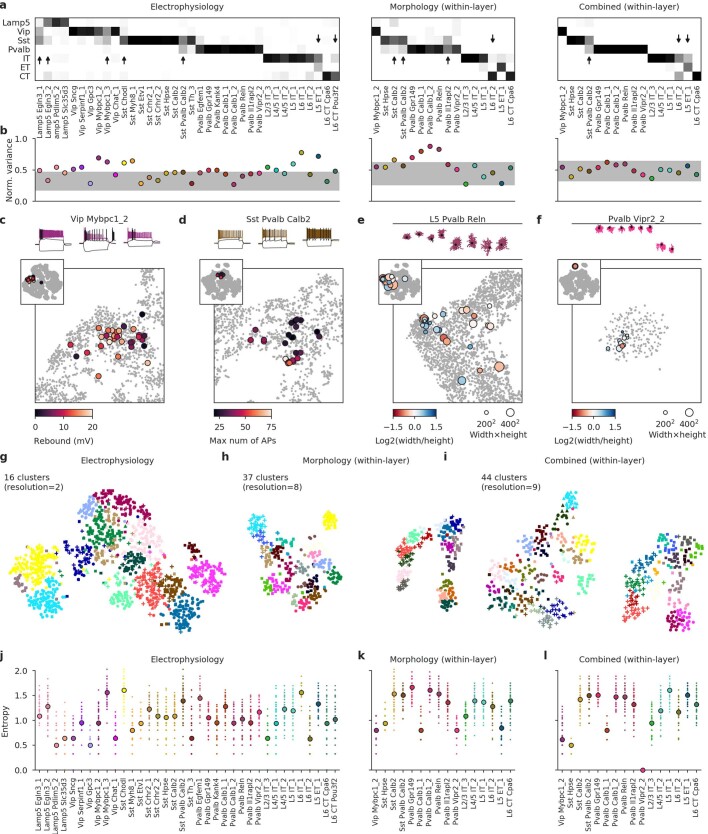
Extended Data Fig. 8. Phenotypic variability of individual t-types.
The extended version of Fig. 5. a, Confusion matrices for classifying cells from each t-type into seven transcriptomic families, using electrophysiological, morphological, and combined features. Only t-types with at least 10 cells are shown. For morphological and combined features we only took cells from one cortical layer. Values in each column sum to 1. Arrows mark t-types that are classified into wrong families more often than 25% of the time. We used kNN-based classifier with k = 10. b, Normalized total variance of features in each t-type. Higher values correspond to t-types with more variable phenotypes. Horizontal grey band shows the min/max normalized variances of k-means clusters. c, Three exemplary traces of cells from the Vip Mybpc1_2 type (all with confidence ≥ 95%) and t-SNE overlay coloured by the rebound. Inset: the same t-SNE embedding as in Fig. 1. Main plot: zoom-in. d, Three exemplary traces of cells from the Sst Pvalb Calb2 (confidence ≥ 95%) and t-SNE overlay coloured by the maximum firing rate. e, Exemplary morphologies of L5 cells from the Pvalb Reln type and t-SNE overlay coloured by the axonal width/height log-ratio as in Fig. 4e. f, Exemplary morphologies of Pvalb Vipr2_2 chandelier neurons and t-SNE overlay coloured by the axonal width/height log-ratio as in Fig. 4e. g–i, We used Leiden clustering35 to cluster the cells based on electrophysiological, morphological, and combined features. The clustering resolution was adjusted to roughly match the number of e-types, m-types, and em-types from ref. 24. The cluster colours in these panels are arbitrary and not the same as the colours used for t-types. j–l, For each t-type with at least 10 cells, we measured the entropy of the cluster assignments. Entropy zero corresponds to all cells getting into one cluster. Higher entropies mean that cells get distributed across many clusters. We repeated the clustering 100 times with different random seeds, and for each of them, subsampled each t-type to 10 cells to measure the entropy. Points show 100 repetitions, big markers show medians. When using morphological and combined features, all t-types were layer-restricted, as above. The t-type colours do not correspond to the colours in panels (j–i).

