
Fig. 2. Sparse reduced-rank regression.
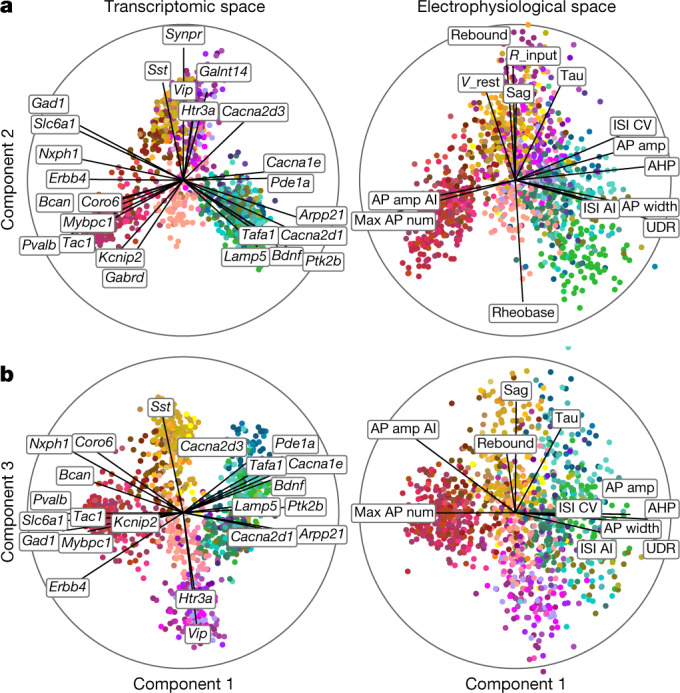
a, b, A sparse reduced-rank regression (RRR) model32 to predict combined electrophysiological features from gene expression. Transcriptomic data are linearly projected to a low-dimensional space that allows reconstruction of electrophysiological data; components 1 and 2 (a) and 1 and 3 (b) of rank-5 model are shown. n = 1,219. Colour corresponds to t-type. The model selected 25 genes (left). Each panel is a biplot, showing correlations of original features with both components; the circle corresponds to correlation 1. Only features with average correlation above 0.4 are shown. Labels were automatically positioned to reduce overlap. AI, adaptation index; AP, action potential; CV, coefficient of variation; ISI, interspike interval; R_input, input resistance; V_rest, resting potential; UDR, upstroke-to-downstroke ratio.