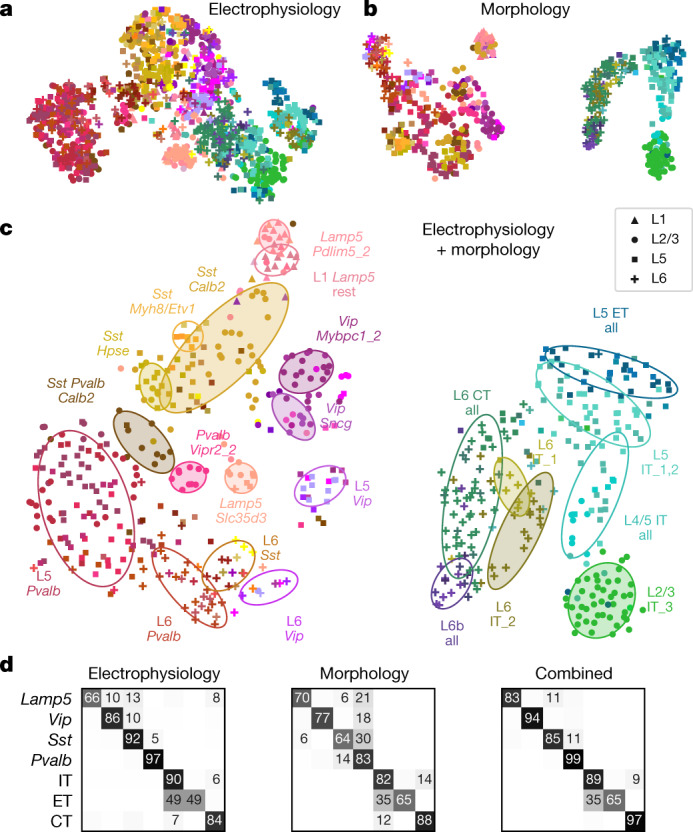
Fig. 3. Morpho-electric t-SNE embeddings.

a, t-SNE embedding constructed using electrophysiological features. Colour corresponds to t-type. n = 1,320 cells used to construct the embedding, 1,219 cells with t-type labels shown. Perplexity, 30. b, t-SNE embedding constructed using combined morphometric features and z-profiles. n = 636 cells. Perplexity, 30. c, t-SNE embedding constructed using combined electrophysiological and morphological features. n = 628 cells. Perplexity, 30. Ellipses show 80% coverage ellipses for the most prominent t-types (shaded) and for some groups of related t-types and some layer-restricted families (unshaded). We chose these groups to reduce the overlap between ellipses. d, Confusion matrices for classifying cells into seven transcriptomic families using kNN classifier (k = 10) and three feature sets. Each row shows what fraction of cells from a given family is classified in each of the seven families. The values in each row sum to 100% but only values above 5% are shown.
