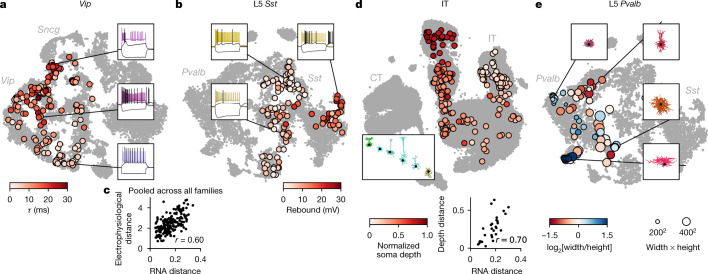
Fig. 4. Phenotypic variability within transcriptomic families.
a, Vip neurons mapped to the reference t-SNE embedding from Fig. 1c, coloured by membrane time constant (τ). Insets, example firing traces. b, Sst neurons from layer 5 (excluding Sst Chodl t-type) mapped to the reference t-SNE embedding from Fig. 1d, coloured by rebound value. c, Correlation between transcriptomic distances and electrophysiological distances across all 200 pairs of t-types from the same family (for 50 t-types with at least 5 cells), pooled across all families. Transcriptomic distance was computed using the reference 10x data as the correlation between average log-expression across most variable genes. Electrophysiological distance is Euclidean distance between the average feature vectors. d, IT neurons mapped to the reference t-SNE embedding from Fig. 1e, coloured by normalized soma depth. Inset, examples of IT neurons at different depths, coloured by t-type. Scatter plot used eight t-types with at least five cells and shows correlation between transcriptomic distances and cortical depth distances. Cortical depth distance is Euclidean distance between the average normalized soma depths. e, Pvalb neurons from layer 5 mapped to the reference t-SNE embedding from Fig. 1d, coloured by axonal width/height log-ratio. Circle area corresponds to the width × height product. Insets, example morphologies.

