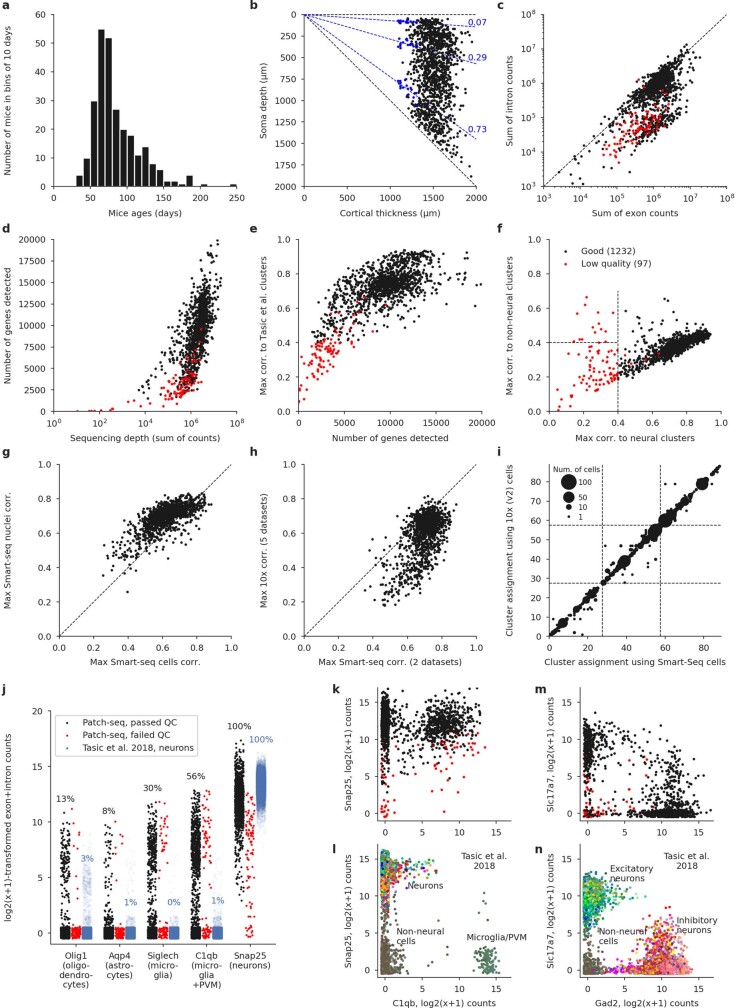
Extended Data Fig. 2. Quality control.
a, Age distribution of the mice used in the experiments. Median: 75 days. b, Soma depths of all cells and cortical thickness of the corresponding slices. Dashed lines show layer boundaries, based on the Nissl-stained slices (measured layer boundaries shown as blue points). All soma depths were normalized by dividing them by the cortical thickness. c, Relationship between the number of exonic and intronic counts. The apparent bimodality could be explained by whether the nucleus was extracted or not during Patch-seq aspiration. Whenever the nucleus was not extracted, low amount of nonspliced RNA led to low intronic counts; otherwise, the number of intronic and exonic counts was almost the same. Red: cells eventually failing quality control. d, Relationship between sequencing depth (total number of reads) and the number of detected genes (number of genes with non-zero counts). e, Relationship between the number of detected genes and the maximal correlation to clusters from ref. 4. Cells with maximal correlation below 0.4 were declared low quality. f, Relationship between the maximal correlation across neural clusters and the maximal correlation across non-neural clusters from ref. 4. Cells with maximal neural correlation below 0.4 were declared low quality. See Methods for additional QC criteria. g, Maximal correlations using single-cell and single-nucleus Smart-seq2 reference data sets20. h, Maximal correlations using Smart-seq2 reference data sets (maximum across cell types and across two data sets) and using 10x reference data sets (maximum across cell types and across five data sets). i, t-Type assignment using single-cell Smart-seq2 reference data set and using single-cell 10x v2 reference data set. All points are on the integer grid; marker size shows the number of cells at the corresponding location. Dashed lines separate CGE-derived interneurons, MGE-derived interneurons, and excitatory neurons. The mapping was done within each order, so there cannot be any cells outside of the diagonal blocks. j, Expression of several prominent markers of non-neural cells, in comparison to the Smart-seq2 data set from ref. 4. The values are log2(x + 1)-transformed sums of exonic and intronic counts, shown with random jitter. Percentage values refer to the fraction of cells with non-zero counts. PVM stands for perivascular macrophages. We selected these markers because they have very low expression in neural cells. A neuronal marker Snap25 is shown for comparison. Cells from the reference data set are shown with the alpha-level set to the ratio of our data set size to that data set size (0.06), to make the dot plots more comparable. k, l, Neural and glial expression in our data set (k) and in the FACS-sorted data set4 (l) (plotted using the colours from the original publication, without transparency). m, n, The same using the excitatory marker Slc17a7 and the inhibitory marker Gad2.

