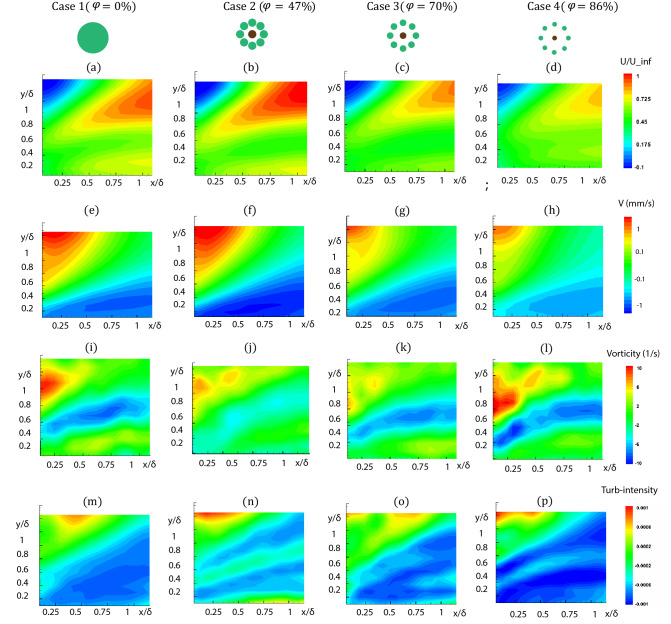
Figure 6.
Time-average flow fields downstream of the patches for different porosities. Left column: case 1, ; Second column: case 2, ; and second from right column: case 3, ; Right column: case 4, ; (a)–(d) Streamwise velocity; (e)–(h) contour of velocity in the Y direction. (i)–(l) contour of vorticity; (m)–(p) contour of turbulence intensity (TI). All results are at Re = 2500 with time step t = 0.008 s and form time period of T = 8 s.

