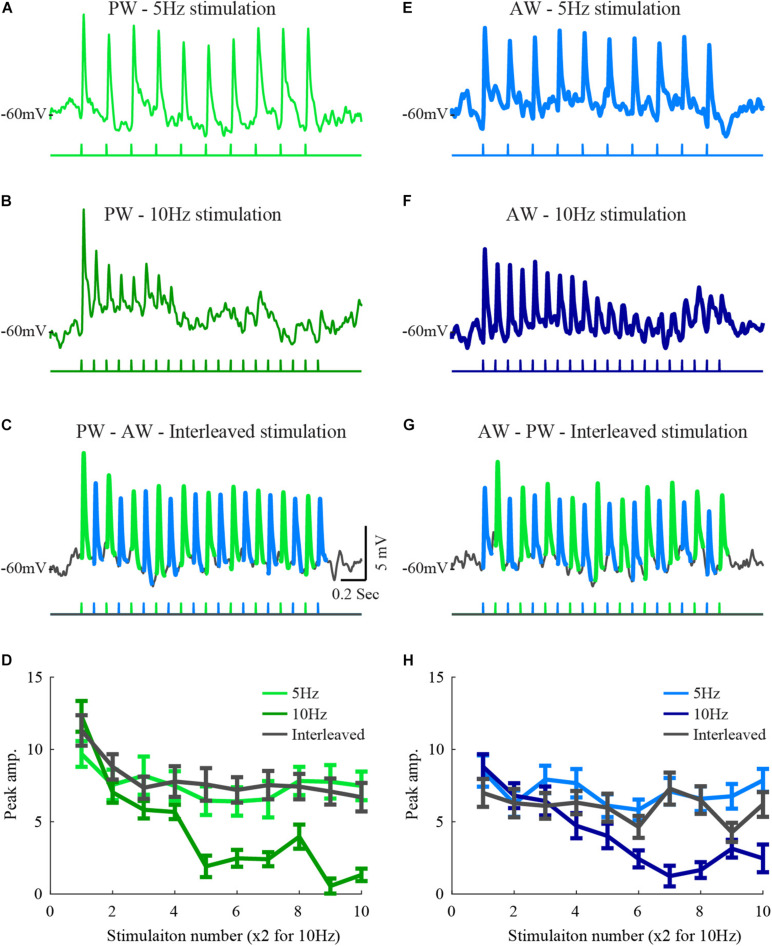
FIGURE 1.
Responses of a layer 2/3 cell to stimulation of two whiskers during interleaved stimulation. (A) The average response of a layer 2/3 cell to 5 Hz stimulation of the principal whisker (stimulation pattern is depicted below the trace). (B) The average response of the same cell to 10 Hz stimulation of the PW principal whisker. (C) The average response to stimulation of the principal whisker and to the adjacent whisker under interleaved stimulation (the trace was segmented by colors to depict the response to the two stimulated whiskers. (D) The average peak amplitudes of the three stimulation patterns in (A–C) are depicted in light-blue for the 5 Hz stimulation, blue for the 10 Hz, and in dark gray for the response to the principal whisker during the interleaved stimulation. (D–H) Same conventions as in (A–D) for responses to the adjacent whisker. The scales are similar for all plots.

