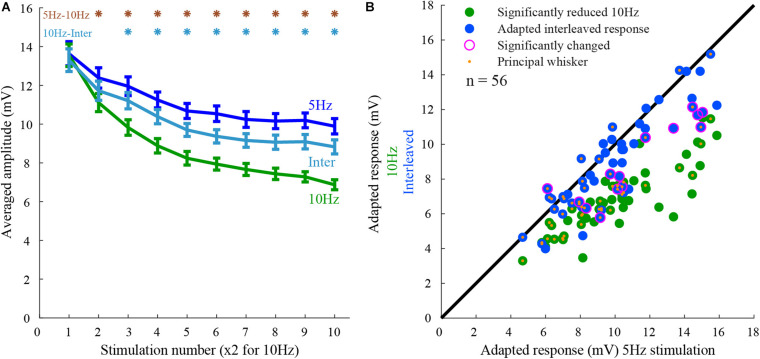
FIGURE 2.
Population response to 5 Hz, 10 Hz, and interleaved stimulation. (A) The peak amplitude of the responses to the three stimulation conditions (5Hz, 10Hz, and interleaved). Note that cells exhibited adaptation from the second stimulus onward. The degree of adaptation during the interleaved stimulation was closer to that for 5 Hz stimulation than for the 10 Hz. The responses to 10 Hz stimulation were significantly different from the others, as marked by the asterisks (rank-sum, p < 0.05). (B) Responses of layer 2/3 cells (each point represents a single whisker test) to whisker deflection at 10 Hz and interleaved stimulation protocols are compared to that obtained by 5 Hz stimulation. The adapted-state response to stimulation of each whisker obtained by the control stimulation pattern (5 Hz) was on average larger than the response to 10 Hz stimulation (green) and interleaved stimulation (blue). Large magenta circles indicate a significant difference from the response to 5 Hz stimulation. Orange dots mark the principal whiskers.

