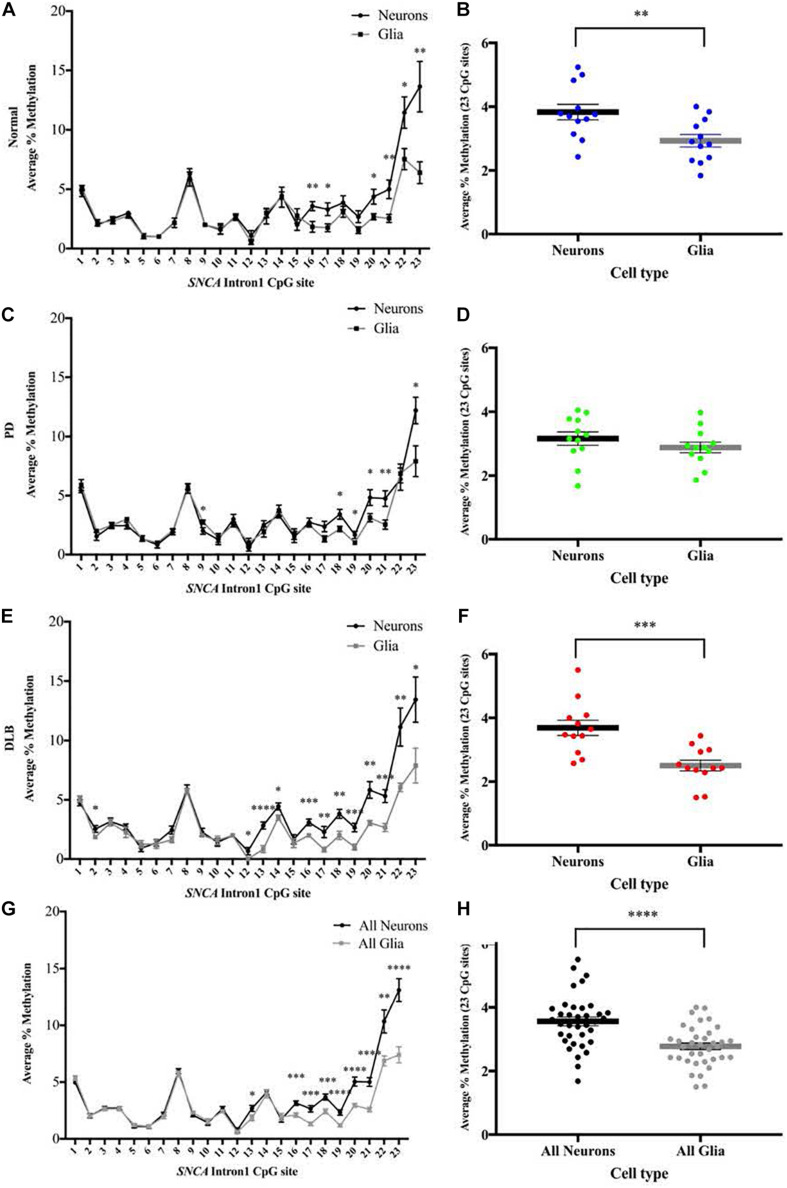
FIGURE 4.
DNA methylation profiles of the SNCA intron 1 CGI in neuron vs glia from frontal cortex tissues. DNA from each sorted nuclei sample was bisulfite converted, and the methylation (%) of the individual CpGs was quantitatively determined by pyrosequencing. Left: Graphs depict the average percentage of DNA methylation level at each of the 23 CpG sites within SNCA intron 1 CGI from (A) 12 normal, (C) 12 PD, (E) 12 DLB, and (G) all 36 subjects. Box-and-scatterplot charts display for each sorted neuronal and glia nuclei sample from each subject the DNA methylation average percentages across all 23 CpG sites within the SNCA intron 1 CGI [Chr4: 89,836,150-89,836,593 (GRCh38/hg38)] (denoted by point). The box plots also depict the mean (denoted by thick horizontal lines) and upper and lower quartiles (denoted by thin lines) of DNA methylation average percentages across all 23 CpG sites for all sorted neuronal and glia nuclei samples from (B) 12 normal, (D) 12 PD, (F) 12 DLB, and (H) all 36 subjects. The significance of the differences in % of methylation was tested using the Student’s t-test and denoted by asterisks (∗) for neuron vs glia comparisons, with ∗p < 0.05, ∗∗p < 0.01, ∗∗∗p < 0.001, and ****p < 0.0001.

