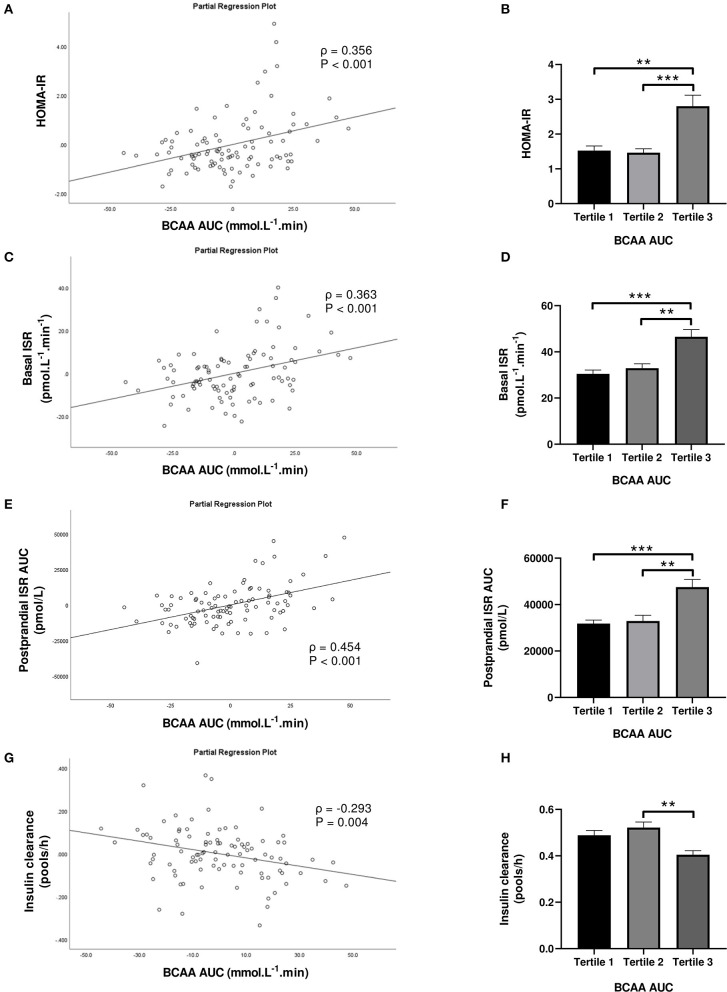
Figure 5.
Homeostasis Model Assessment of Insulin Resistance (HOMA-IR; A,B), basal insulin secretion rate (ISR; C,D), total postprandial ISR area under the curve (AUC; E,F) and insulin clearance (G,H) in relation to postprandial BCAA AUC (left) and in subjects stratified to tertiles of postprandial BCAA AUC (right). Data are mean ± SEM; n = 31–32 per group. Continuous analyses are depicted as partial correlation plots and differences among tertiles are determined by one-way ANOVA. All analyses have been adjusted for sex and BMI. Corresponding values are significantly different between groups (Šidák-corrected): **P < 0.01, ***P < 0.001.

