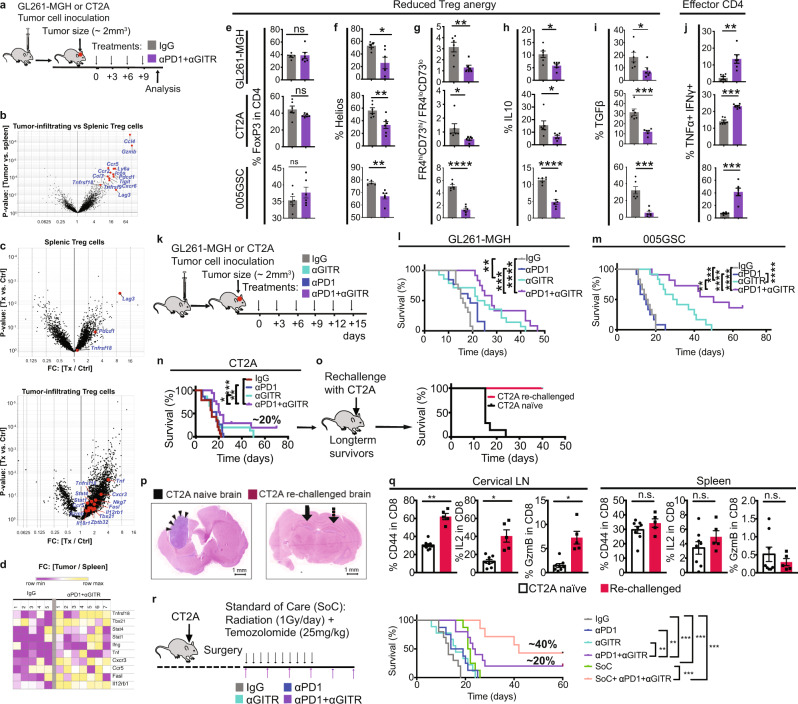
Fig. 3. αPD1 + αGITR converts GBM Treg cells to Th1 effector T cells leading to enhanced survival and CD8 T cell memory phenotype in mice.
a Schematic representation of experimental protocol, where mice bearing orthotopic GL261-MGH, CT2A, or 005GSC tumors and treated with 4 doses of either IgG2a (isotype control), or αGITR + αPD1 (n = 6, day 10 post-randomization and treatment). Spleen and tumors were harvested, and cells were sorted for Treg cells. b–d RNA-seq analysis was performed on GBM Treg cells and spleens of IgG2a (isotype control, n = 5) vs. αGITR + αPD1 treated CT2A bearing animals (n = 7). b Volcano plots showing differentially expressed genes (DEGs) between spleen and GBM Treg cells treated with IgG2a. c Volcano plot showing DEGs between Treg cells from mice treated with IgG2a or αGITR + αPD1 in the spleen (Top panel) and GBM (lower panel). Genes of interest are highlighted. d Heatmap of representative Th1 genes expressed in GBM Treg cells upon IgG2a (left) or αGITR + αPD1 (right) treatment. e–j Intratumoral Treg cells in mice bearing orthotopic GL261-MGH, CT2A, or 005GSC tumors and treated with 4 doses of either IgG2a (isotype control) or αGITR + αPD1 (n = 6 biological replicate, day 10 post-randomization and treatment) analyzed by flow cytometry for (e) Treg cell frequency [(GL261-MGH, P = 0.8819), (CT2A, P = 0.1108), (005GSC, P = 0.2753)] (f) expression of Helios [(GL261-MGH, P = 0.0173, 95% confidence interval:−48.63 to −5.949), (CT2A, P = 0.009, 95% confidence interval:), (005GSC, P = 0.0016, confidence interval:−16.41 to −5.383)], (g) co-expression of CD73 and FR4 [(GL261-MGH, P = 0.0034, 95% confidence interval: −2.930 to −0.7693), (CT2A, P = 0.0455, 95% confidence interval: −38.89 to −7.140), (005GSC, p < 0.001, confidence interval:−4.544 to −2.939)], (h) production of IL-10 [(GL261-MGH, P = 0.0108, 95% confidence interval: −7.707 to −1.293), (CT2A, P = 0.0329, 95% confidence interval: −17.11 to −0.8946), (005GSC, p < 0.001, confidence interval: −8.447 to −4.595)], (i) TGFβ [(GL261-MGH, P = 0.0362, 95% confidence interval: −20.59 to −0.8395), (CT2A, P = 0.0002, 95% confidence interval: −27.18 to −11.58), (005GSC, P = 0.0002, confidence interval:−37.65 to −16.17)], and (j) coproduction of IFNγ and TNFα [(GL261-MGH, P = 0, 95% confidence interval: 0.2742–19.22), (CT2A, p < 0.001, 95% confidence interval: 6.848–11.15), (005GSC, P = 0.0002, confidence interval: 20.87–47.81)]. Two-tailed unpaired t-test for these analyses, and stars were assigned as *p < 0.05, **p < 0.01, ***p < 0.001, ****p < 0.0001. k Schematic representation of the experimental protocol. l–n Mice bearing orthotopic GBM tumors (GL261-MGH, 005GSC or CT2A, size ~2 mm3) were treated with six doses of (i) IgG2a, (ii) αPD1, (iii) αGITR, or (iv) αGITR + αPD1 (250 µg/mice for each antibody) and monitored for survival, (Survival study repeated two times). GL261-MGH [(IgG n = 13 and median survival 16 days), (αPD1 n = 13 and median survival 19 days), (αGITR n = 14 and median survival 23.5 days), (αPD1 + αGITR n = 12 median survival 28 days)], CT2A ([(IgG n = 14 and median survival 14 days), (αPD1 n = 15 and median survival 18 days), (αGITR n = 15 and median survival 18 days), (αPD1 + αGITR n = 13 median survival 21 days), 005GSC ([(IgG n = 12 and median survival 15.5 days), (αPD1 n = 12 and median survival 14.5 days), (αGITR n = 12 and median survival 30 days), (αPD1 + αGITR n = 11 median survival 50 days). Statistical significance is shown as *p < 0.05, **p < 0.01, ***p < 0.001, ****p < 0.0001. o Long-term survivors (4 out of 24 mice) with no evidence of residual CT2A tumors in the CT2A cohort were re-challenged with CT2A cells in the contralateral hemisphere of the brain and compared with CT2A naïve mice (n = 7) that were inoculated with CT2A tumor. Survival data is representative of 2 independent experiments. CT2A naïve (median survival of 15 days), and CT2A-rechallenged (not applicable). p Arrows indicate the tumor inoculation region in the brain. Histology of brains from tumor-bearing brains (left) where arrowheads indicate a tumor, and CT2A re-challenged mice (right) where the arrow indicates the primary injection site, and the dashed arrow indicates the secondary injection site. q Levels of activation and cytokine production by CD8 T cells from spleen and cervical LNs of re-challenged mice (n = 5) and CT2A naïve mice (n = 8, day 12 post-randomization). Two-tailed unpaired t-test for these analyses, and stars were assigned as *p < 0.05, **p < 0.01, ***p < 0.001, ****p < 0.0001. Draining Lymph node: [(%CD44 in CD8, p < 0.0001, 95% confidence interval: 24.38–39.23), (%IL2 in CD8, P = 0.0006, 95% confidence interval: 15.22–41.17), (%GzmB in CD8, p = 0.0004, confidence interval: 3.282–8.318)] and Spleen: [(%CD44 in CD8, P = 0.2537), (%IL2 in CD8, P = 0.2538), (%GzmB in CD8, p = 0.4357)]. r Schematic representation of experimental protocol where mice bearing orthotopic CT2A tumors received tumor resection, followed by treatment with IgG2a (control, n = 8), αPD1 (n = 8), αGITR (n = 9), αGITR + αPD1 (n = 8), clinically relevant standard of care (SoC, n = 8) consisting of cranial radiation therapy (1 Gy per day for 10 days) and concomitant daily chemotherapy with temozolomide 25 mg (i.p. for 10 days) or combination treatment with surgery, or chemo-radiation plus αGITR + αPD1 therapy (n = 7). Kaplan–Meier survival estimates were compared using the Mantel–Cox log-rank test as well as the Gehan–Breslow–Wilcoxon test. P values for tumor viability were calculated using unpaired t-tests. *p < 0.05, **p < 0.01, ***p < 0.001. CT2A ([(IgG median survival 8 days), (αPD1 median survival 9 days), (αGITR median survival 22.5 days), (αPD1 + αGITR median survival 21.5 days), (SoC median survival 14 days), (SoC+αGITR + αPD1 median survival 42 days)]. Source data are provided as a Source Data file.

