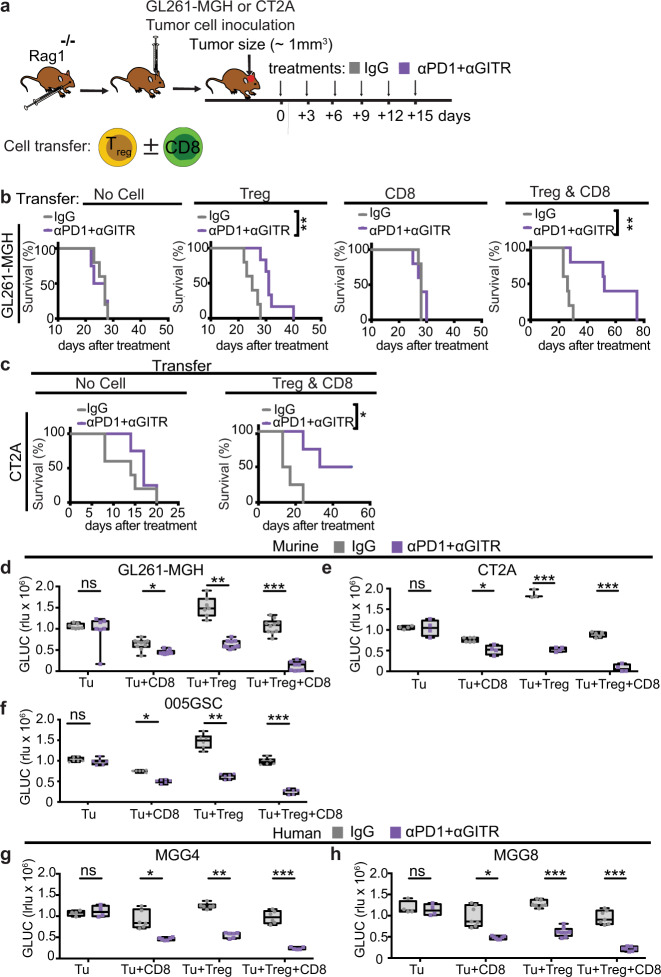
Fig. 4. CD4 Treg cells are sufficient to elicit the therapeutic effect of αPD1 + αGITR and induce tumor cell killing.
a Schematic representation of the experimental setup to evaluate the contributions of CD8 T cells and Treg cells to antitumor activity against GBM during αPD1 + αGITR treatment. Purified and sorted CD8 T cells (1 × 10⁶), Treg cells (5 × 10⁵), or both were transferred to Rag1−/− mice 2 days before intracranial inoculation with tumor cells (GL261-MGH or CT2A). b–c GL261-MGH and CT2A bearing mice were treated with 6 doses of IgG2a or αPD1 + αGITR (250 μg/mouse for each antibody) and monitored for survival. [(GL261-MGH no cell: n = 5, IgG median survival of 27; αPD1 + αGITR, n = 5 median survival of 25], [(GL261-MGH CD8 T cells: IgG n = 5 median survival of 27; αPD1 + αGITR, n = 5 median survival of 25], [(GL261-MGH Treg cells: IgG n = 5 median survival of 25; αPD1 + αGITR, n = 6 median survival of 31], [(GL261-MGH CD8 + Treg cells: IgG n = 5 median survival of 26; αPD1 + αGITR, n = 5 median survival of 52]; [(CT2A no cell: n = 5, IgG median survival of 14; αPD1 + αGITR, n = 4 median survival of 17], [(CT2A CD8 + Treg cells: IgG n = 4 median survival of 15; αPD1 + αGITR, n = 4 median survival undefined]. Kaplan–Meier survival estimates were compared using the Mantel–Cox log-rank test as well as the Gehan–Breslow–Wilcoxon test. P values for tumor viability were calculated using unpaired t-tests. *p < 0.05, **p < 0.01. d–h Treg cells and CD8 T cells were isolated from spleens of healthy donor mice (n = 6 per condition) or human peripheral blood mononuclear cells (pooled from n = 3 donors). d–f Murine GL261-MGH or CT2A or 005GSC (g–h) human MGG4 or MGG8 tumor cells (1 × 10³ cells) were co-cultured for 48 h with Treg cells, CD8 T cells, or both in ratios of 1:10. GLUC activity in the cell culture media was measured and used as a surrogate marker for tumor cell viability. Tumor cell viability was measured under treatment with IgG2a (isotype control) or αPD1 + αGITR. Data presented are mean ± SEM. p < 0.001 by ordinary one-way ANOVA test and were corrected for multiple comparisons using the Tukey adjustment. For between group analysis post-Tukey, stars were assigned as *p < 0.05, **p < 0.01, ***p < 0.001. The line in the middle of the box and whisker graph represents the median (50th percentile). The box extends from the 25 to 75th percentile. The whiskers extend from the lowest to the highest value. Source data are provided as a Source Data file.

