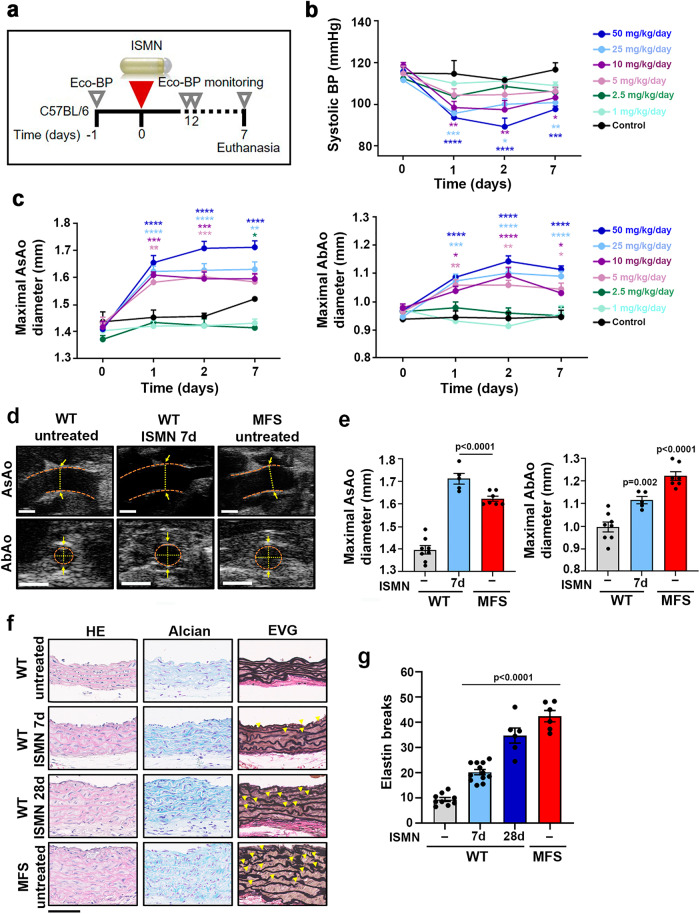
Fig. 3. ISMN induces an MFS-like aortopathy in WT mice.
a Experimental design. 12-week-old C57BL/6 mice were treated for 7 days (d) with the NO-donor ISMN at 1, 2.5, 5, 10, 25, or 50 mg/kg/day by osmotic minipump infusion. Mice were monitored by Eco-BP (ultrasound and BP analysis) at the indicated times (empty triangles). b Systolic BP during ISMN infusion. c Maximal AsAo diameter (left) and AbAo diameter (right) during ISMN infusion. Data in b and c are mean ± s.e.m; n = 5 per treated group, n = 3 for control group. *P < 0.05, **P < 0.01, ***P < 0.001, and ****P < 0.0001 (versus control at each time point) by repeated-measurements two-way ANOVA with Bonferroni’s post-hoc test. d Representative ultrasound images (orange dashed lines delineate the lumen boundary and yellow dashed lines mark the lumen diameter) and e quantification of end-of-experiment maximal AsAo and AbAo diameter in untreated WT mice (−) (n = 8), MFS mice (n = 7), and WT mice treated with 50 mg/kg/day ISMN for 7 d (n = 5). Each data point denotes an individual mouse, whereas histograms show mean ± s.e.m. f Representative staining with hematoxylin and eosin (HE) (left), Alcian blue (middle), and elastic van Gieson (EVG) (right) in the AsAo from 9 to 12-week-old untreated WT mice (−), 6 MFS mice, and WT mice treated with 50 mg/kg/day ISMN for 7 d (n = 12 mice) or 28 d (n = 6 mice). Yellow arrowheads indicate elastin breaks. Scale bar, 50 μm. g Quantification of elastin breaks in AsAo sections from 9 to 12-week-old untreated WT mice (−), 6 MFS mice, and WT mice treated with 50 mg/kg/day ISMN for 7 d (n = 12 mice) or 28 d (n = 6 mice). Each data point denotes an individual mouse, whereas histograms denote mean ± s.e.m. e, g Differences were analyzed by one-way ANOVA with Dunnett’s post-hoc test (p-values are shown). Source data are provided in the Source Data file.

