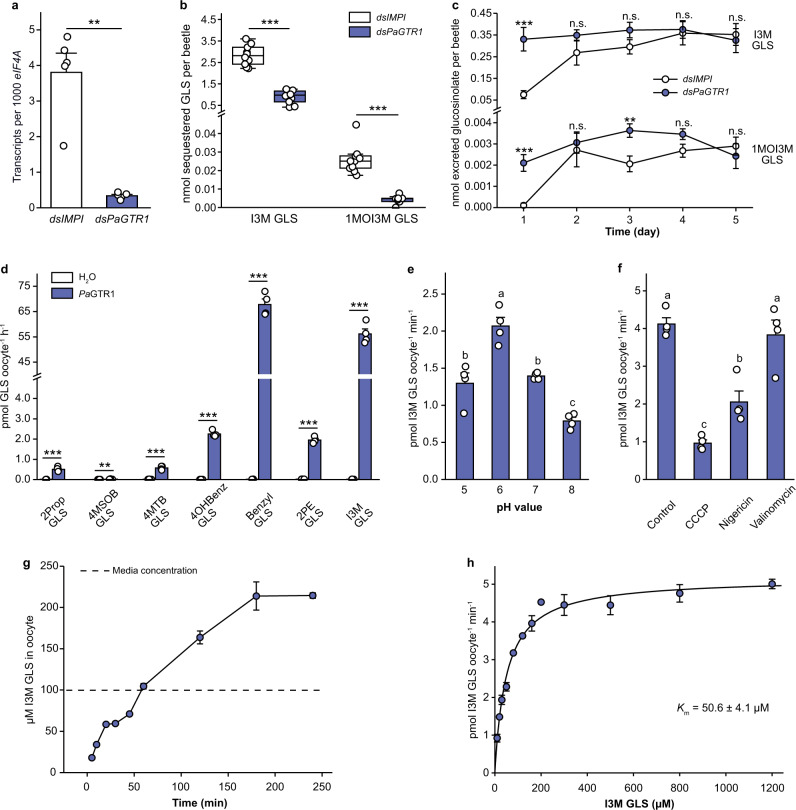
Fig. 2. Functional and biochemical characterization of PaGTR1-mediated glucosinolate transport.
a PaGTR1 expression in P. armoraciae 4 days after dsRNA injection (n = 5 biological replicates, three beetles per replicate). b Accumulation of indol-3-ylmethyl (I3M) GLS and 1-methoxyindol-3-ylmethyl (1MOI3M) GLS in adult P. armoraciae beetles after 5 days feeding on Arabidopsis leaves. Box plots show the median, interquartile range, and outliers of each dataset (n = 10 biological replicates, five beetles per replicate). c Excreted amounts of I3M GLS and 1MOI3M GLS over 5 days feeding on Arabidopsis (n = 9–10 biological replicates, feces of five beetles per replicate). d Substrate preference of PaGTR1. Oocytes expressing PaGTR1 and control oocytes were incubated with equimolar mixtures of seven glucosinolates (n = 4 biological replicates, three oocytes per replicate). e pH dependency of PaGTR1 (n = 4 biological replicates, three oocytes per replicate). f Effects of different ionophores on PaGTR1-mediated glucosinolate transport (n = 4 biological replicates, three oocytes per replicate). g Time course of glucosinolate accumulation in Xenopus oocytes expressing PaGTR1 (n = 4 biological replicates, three oocytes per replicate). h Kinetic analysis of PaGTR1-mediated I3M GLS transport (n = 4 biological replicates, three oocytes per replicate). Data are shown as mean ± s.e.m. Treatments were compared by two-tailed Student’s t test, Mann–Whitney U test or the method of generalized least squares (a–d), or one-way analysis of variance (ANOVA). Bars labeled with different letters are significantly different (e, f; P < 0.05). n.s. Not significantly different; **P < 0.01 and ***P < 0.001. P values are provided in Supplementary Data 6.

