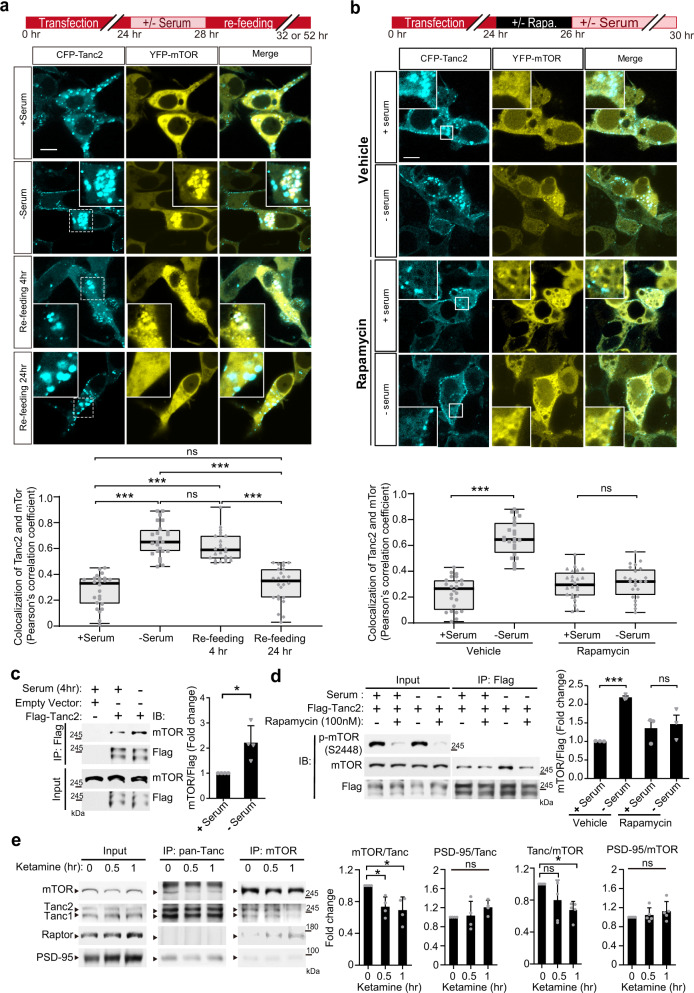
Fig. 6. Serum and ketamine regulate the interaction of Tanc2 with mTOR.
a Serum starvation induces colocalization of Tanc2 and mTOR in HEK293T cells, an effect that is reversed by serum refeeding. HEK293T cells transfected with CFP-Tanc2 + YFP-mTOR were subjected to serum starvation (-serum) to inactivate mTOR, or to no serum starvation (control; +serum), for 4 h followed by serum refeeding for 24 h while checking changes at 4- and 24-h time points. The colocalization was quantified using Pearson’s correlation analysis of colocalized pixels (see “Methods” for details). Data: minimal, maximal, median, 25 and 75% values. (n = 24 cells from three independent experiments. ***P < 0.001, ns not significant, one-way ANOVA with Bonferroni test). Scale bar, 10 μm. b Rapamycin blocks serum starvation-induced Tanc2–mTOR colocalization in HEK293T cells. HEK293T cells expressing CFP-Tanc2 and YFP-mTOR were treated with rapamycin or vehicle for 2 h before starting serum starvation. Colocalization was quantified by Pearson’s correlation analysis of colocalized pixels (see “Methods” for details). Data: minimal, maximal, median, 25 and 75% values. (n = 24 cells from three independent experiments. ***P < 0.001, ns not significant, Student’s t test). Scale bar, 10 μm. c Increased biochemical association between Tanc2 and mTOR induced by serum starvation in HEK293T cells, as determined by coimmunoprecipitation (coIP). HEK293T cells expressing Flag-Tanc2 and mTOR (endogenous) in the presence and absence of serum starvation (4 h) were immunoprecipitated with Flag antibody (for Tanc2) and immunoblotted as indicated. The lower Flag-Tanc2 band represents a degradation product. mTOR signals were normalized to Tanc2 signals for quantification. Data: mean ± SD. (n = 4 independent experiments, *P < 0.05, Student’s t test). d Rapamycin blocks the serum starvation-induced biochemical association of Tanc2 with mTOR in HEK293T cells, as determined by coimmunoprecipitation. HEK293T cells expressing Flag-Tanc2 and mTOR (endogenous) were treated with rapamycin or vehicle for 2 h before starting serum starvation, followed by immunoprecipitation with Flag antibodies (for Tanc2) and immunoblotting, as indicated. mTOR signals were normalized to Tanc2 (Flag) signals for quantification. Data: mean ± SD. (n = 3 independent experiments, ***P < 0.01, ns not significant, Student’s test). e Reduced biochemical association between Tanc1/2 and mTOR in the mouse brain (P13–14) upon ketamine treatment (10 mg/kg; i.p.), as shown by coIP experiments on whole-brain crude synaptosomes from ketamine-treated and -untreated mice using pan-Tanc or mTOR antibodies, followed by immunoblotting. Raptor was immunoblotted to show mTOR activation, and PSD-95 was immunoblotted for the coprecipitation with Tanc1/2 (positive control). Data: mean ± SD. (n = 4 independent experiments, *P < 0.05 [compared with 0 h], ns not significant, one-way ANOVA with Bonferroni test). See Source Data 1 for raw data values and Supplementary Table 1 for statistical details.

