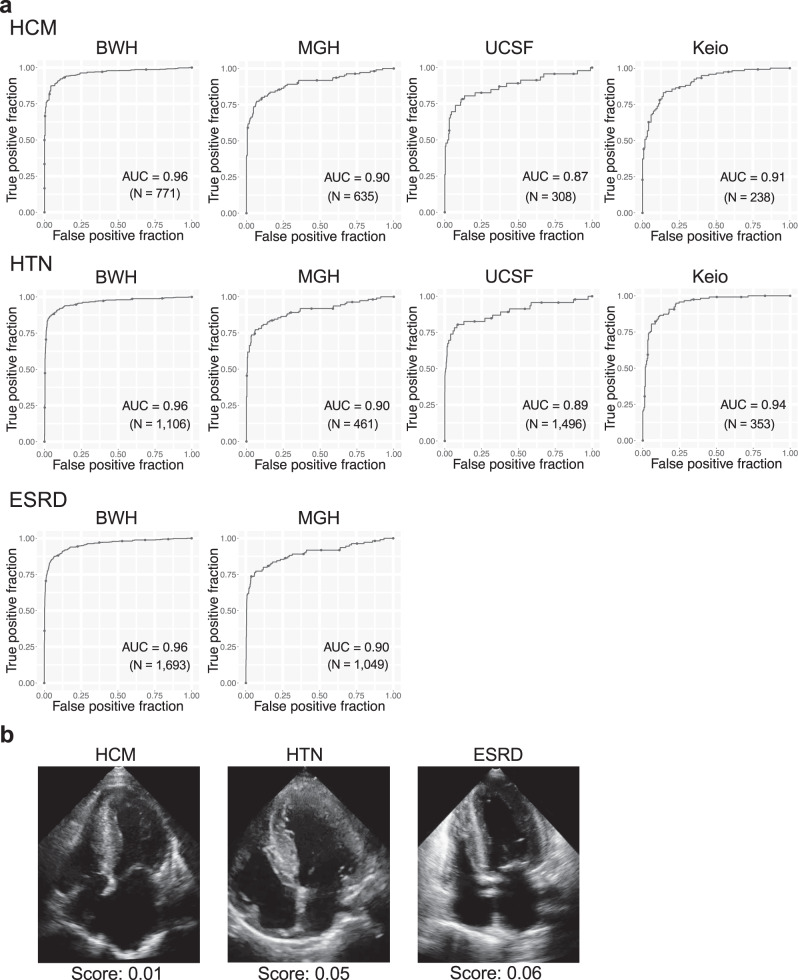
Fig. 3. Performance of the echocardiography model for discriminating cardiac amyloidosis from HCM, HTN and ESRD.
a ROC plots for detecting cardiac amyloidosis for each institution. The performance on the test dataset is shown for BWH-HCM. b Representative images for selected controls for each disease. The score denotes the model output for the video. N is the numbers of studies. Source data are provided as a Source Data file. HCM: hypertrophic cardiomyopathy, HTN: hypertension, ESRD: end-stage renal disease. BWH: Brigham and Women’s Hospital, MGH: Massachusetts General Hospital, UCSF: University of California San Francisco, Keio: Keio University. AUC: area under the curve.

