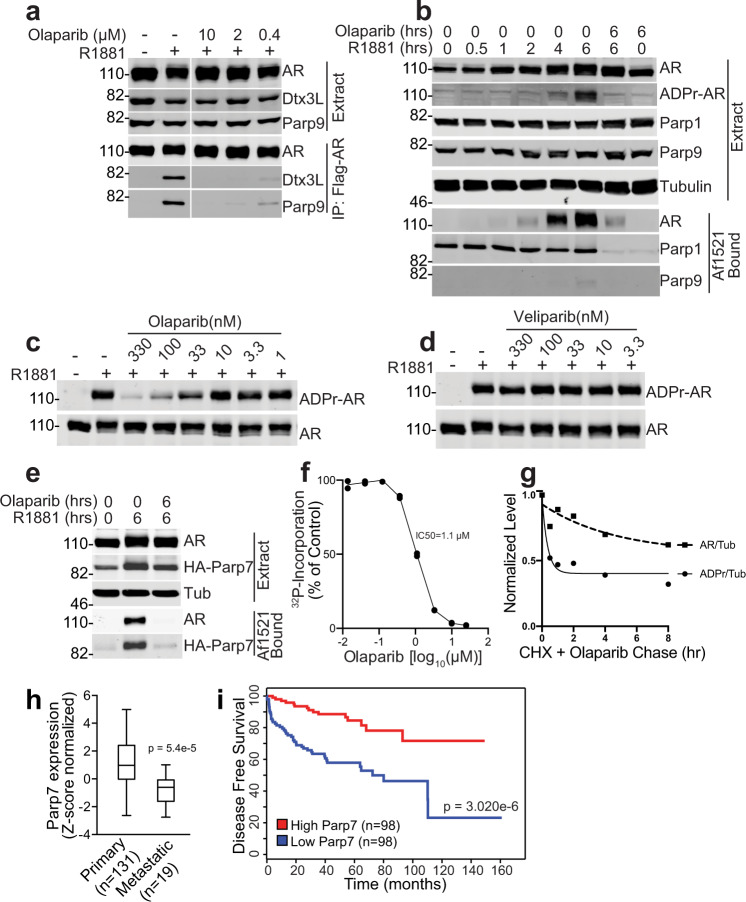
Fig. 5. Olaparib inhibits AR ADP-ribosylation and complex assembly.
a Olaparib inhibits androgen-induced AR-Dtx3L/Parp9 complex formation. PC3-AR cells were treated with R1881 (2 nM) and the concentrations of Olaparib indicated. Extracts were used to IP AR, and the bound fractions were probed for AR, Dtx3L, and Parp9. b Olaparib inhibits androgen-induced AR ADP-ribosylation. PC3-AR cells were treated with R1881 and Olaparib in the combinations and times indicated. Cell extracts were used for Af1521 pulldowns, and the extracts and bound fractions were analyzed by blotting for AR, ADPr-AR, Parp1, and Parp9. c Concentration dependence of Olaparib inhibition of AR ADP-ribosylation. PC3-AR cells were co-treated with R1881 and the indicated concentrations of Olaparib, and the levels of AR and ADP-ribosylation examined by blotting. Olaparib inhibition of Parp1 automodification was verified by immunoblotting (Supplementary Fig. 21a). d The Parp1/2 inhibitor Veliparib does not inhibit AR ADP-ribosylation. PC3-AR cells were co-treated with R1881 and the indicated concentrations of Veliparib, and the levels of AR and ADP-ribosylation examined by blotting. Veliparib inhibition of Parp1 automodification was verified by immunoblotting (Supplementary Fig. 21b). e Parp7 automodification in cells and binding to Af1521 beads is inhibited by Olaparib. PC3-AR-HA-Parp7 cells were co-treated with R1881 and Olaparib for the indicated times, and cell extracts were analyzed by Af1521 pulldown and immunoblotting for AR and HA-Parp7. f Parp7 automodification in vitro is inhibited by Olaparib. Recombinant Parp7 expressed and purified from insect cells was incubated with 32P-NAD+ with a range of Olaparib concentrations, the level of automodification quantified and plotted after autoradiography. g Olaparib chase experiment indicates that AR has ADP-ribosylation sites with fast and slow turnover. PC3-AR cells were treated with R1881 overnight, and subsequently chased with Olaparib (10 μM) and CHX (100 μg/ml) to prevent further ADP-ribosylation and AR synthesis, respectively. The levels of AR and AR ADP-ribosylation were measured and plotted as a function of tubulin level. h Parp7 expression levels (Z-score normalized, RNA-seq data) in primary and metastatic prostate tumors. The box shows the median and the upper and lower quartiles, and the whiskers indicate the minimum and maximum. Expression levels were compared by unpaired, two-tailed t test. Further details of the analysis are contained in “Methods”. i Prostate cancer patient outcome stratified by Parp7 expression levels (RNA-seq). Plotted is the time of disease-free survival for patients with high Parp7 levels (red) versus low Parp7 levels (blue). P value determination by a log-rank test is shown. Source data are provided as a Source data file.

