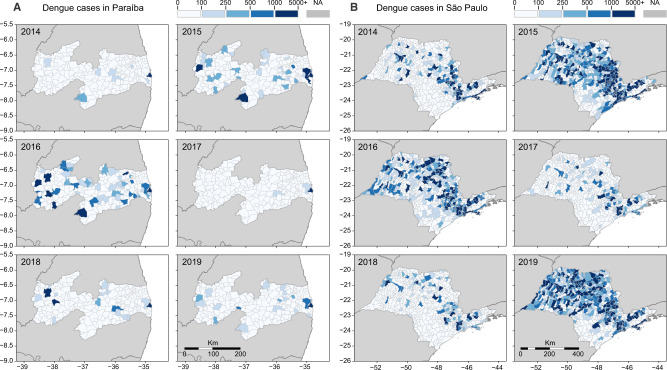
Fig. 2. Reported dengue cases per municipality in Paraíba and São Paulo states, 2014–2019.
The dynamics of dengue in A Paraíba and B São Paulo between 2014 and 2019 followed similar cyclic patterns observed throughout Brazil: a decline in cases in 2014, followed by 2 years of high incidence (2015–2016), succeeded by 2 years of low incidence (2017–2018), with a resurgence of dengue in 2019. As in Figs. 5 and 6, the three main cities included in our study are highlighted in each state. In A Paraíba, we show: (1) João Pessoa; (2) Campina Grande; and (3) Coremas. In B São Paulo, we highlight: 1. Ribeirão Preto; 2. Araraquara; and 3. São José do Rio Preto. Normalized dengue incidence per 100,000 population is shown in Fig. S1.

