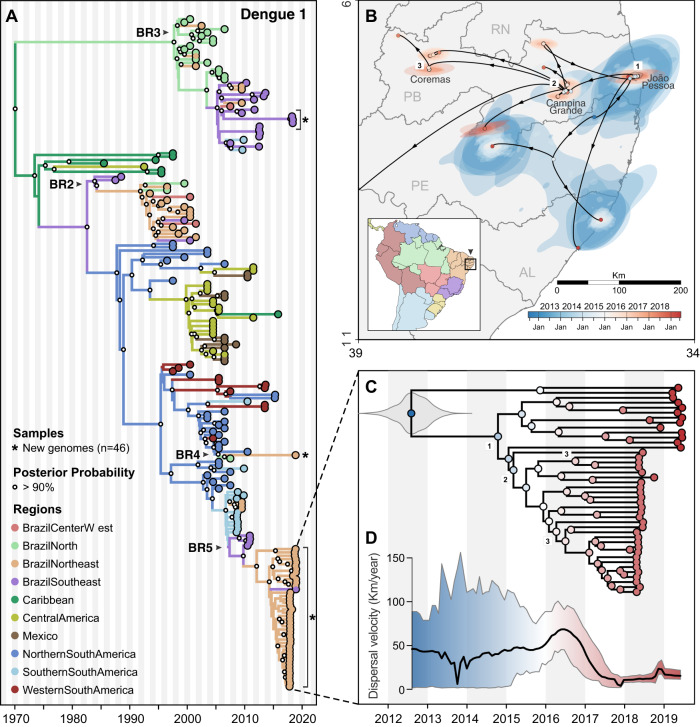
Fig. 5. Regional emergence and cryptic transmission of DENV-1 causing recent outbreaks in Northeast Brazil.
A Time-resolved phylogeny of DENV-1 circulating in the Americas since 1986 (n = 200). Branch colors represent reconstructed ancestral locations using discrete phylogeography. BR2–BR5 represent lineages of DENV-1, numbered in sequential order based on their dates of introduction in Brazil, as previously described49. DENV-1 genomes sequenced in this study (n = 46) are highlighted with asterisks (*). B Continuous phylogeography showing the local spread of DENV-1 in the Northeast Brazil states of Paraíba (PB), Alagoas (AL), and likely Pernambuco (PE). Areas numbered as 1 (João Pessoa), 2 (Campina Grande), and 3 (Coremas) correspond to the main location where DENV-1 circulated in 2018–2019 (see Fig. 2A). Shaded areas represent uncertainties, expressed as the 80% highest posterior density (HPD) of the possible locations of origin of viral ancestors. C The main DENV-1 outbreak clade plotted as movement vectors in (B). The violin plot shows the posterior density interval for the TMRCA. Numbers refer to areas shown in (B). D Weighted lineage dispersal velocity through time, reaching its peak around June 2016, with mean velocity of 69.1 km/year (confidence interval, 45.07–90.91 km/year). To better depict the dynamics of spread in Northeast Brazil, the single vector leading to São Paulo was not considered in the calculations of dispersal velocity.

