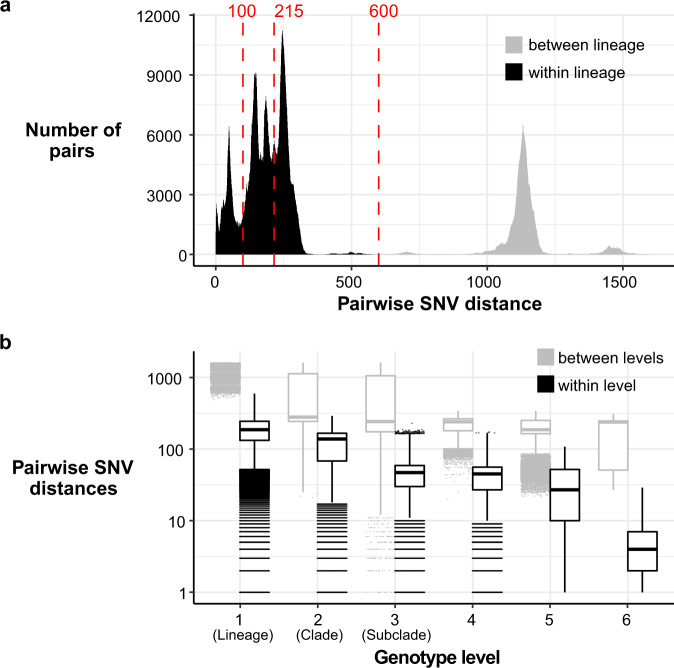
Fig. 2. Distribution of SNV distances in discovery genomes.
a Histogram of pairwise SNV distances between all discovery genomes, coloured by lineage comparison as per legend. Red lines mark SNV cut-offs used to define lineage, clade and subclade levels in genotyping scheme. b Boxplots of pairwise SNV distances (log scale, n = 1,873,081 pairwise distances) between discovery genomes at different hierarchical levels of the defined genotyping scheme. Boxes indicate the median (bold line), 25th to 75th percentiles (box), and the 5th and 95th percentile (whiskers), with outliers shown as points. Lineage, Clade and Subclade refer to the first three levels of the scheme. ‘4’ indicates the fourth level of the scheme (i.e., the final ‘1’ in 3.6.1.1), ‘5’ the fifth level (i.e., the ‘1’ in 3.7.30.4.1), and ‘6’ the sixth level (i.e., the final ‘1’ in 3.6.1.1.3.1).

