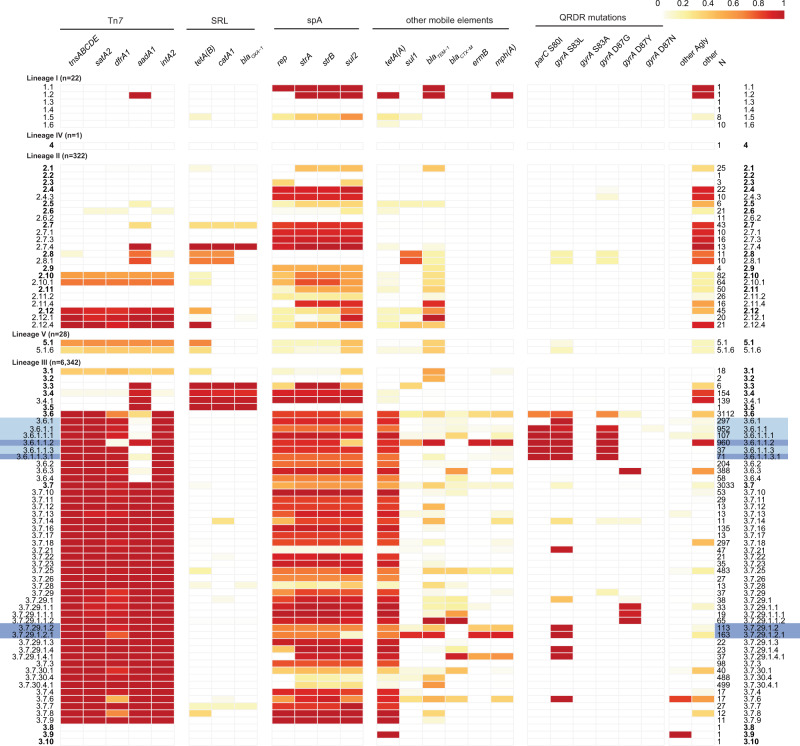
Fig. 3. Frequencies of AMR genetic determinants within individual S. sonnei genotypes, calculated across 6715 genomes.
Cells indicate absence (white) or presence (coloured by proportion as per legend) of each AMR determinant (columns) within each clade or higher-resolution genotype (rows). All clades are included as rows (bold labels); subclades and higher-resolution genotypes represented by ≥10 genomes are also included as distinct rows; number of genomes in each row are noted in column “N”. Light blue shading indicates fluoroquinolone resistant genotypes; dark blue shading indicates MSM-associated genotypes. Columns are grouped by typical location of the AMR determinant (labelled horizontal bars at the top): transposon Tn7, represented by marker genes tnsABCDE and class II integron In2 integrase gene intA2; Shigella resistance locus (SRL); spA plasmid, represented by marker gene rep; other mobile elements; mutations in quinolone resistance determining region (QRDR). Column “other Agly” indicates proportion of genomes carrying at ≥1 additional aminoglycoside resistance gene beyond those with their own columns; column ‘other’ indicates proportion of genomes carrying ≥1 other AMR gene that is not otherwise listed (full AMR gene content per strain is available in Supplementary Data 1).

